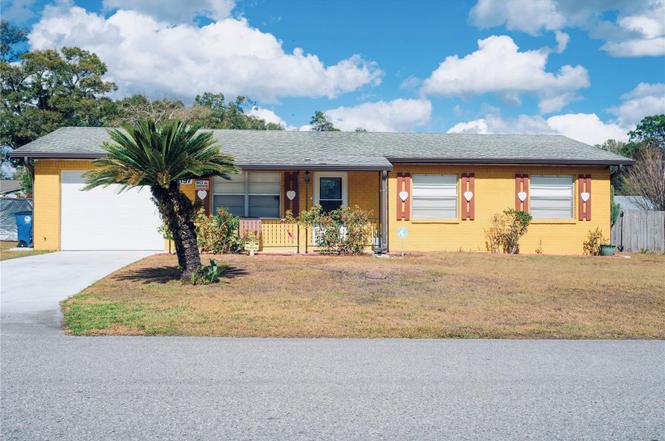
27197 Simona Ave
Hill 'n Dale, FL 34602
$200,000C+
3 bd · 1.0 ba ·
1,080 sqft ·
Built 1979
· SingleFamily
· Active
· 156 DOM
Cashflow @ list (25.0% down · 7.5%)
Estimated rent
$2,074/mo
Mortgage (P&I)
−$1,049
Tax + insurance
−$229
HOA
−$0
Vac / Maint / Mgmt
−$436
Net cashflow
$361/mo
Annual
$4,335/yr
Cap rate
8.86%
Cash-on-cash
9.16%
DSCR
1.41
1% rule
1.04%
Cash to close
$56,000
Investor read
- This is a 3-bed/1.0-bath single-family listed at $200k.
- At list price, monthly cash flow is $361 ($4k/yr) — positive.
- The deal already cash-flows at list — no discount required.
- Meets the 1% rule at list price ($2k rent vs $200k).
- It's been on market 156 days — a 12% lower offer ($176k) is reasonable based on typical stale-listing flexibility.
- Recommended offer: $176k (12.0% below list) — sets the bar for market timing.
- Local home prices are declining (-3.0%/yr); year-one equity from $1k of loan paydown is wiped out by about $6k of value loss. Plan a longer hold.
- Location reads: area grade C — affects rentability + tenant quality, not the cash-flow math above.
- Hernando (suburban): math 50% / reading 50% proficiency, ranked #38 of 73 in FL (top 52%) — acceptable for families but not a draw, mixed tenant base, ~2y average lease.
- Zoned schools: Eastside Elementary School (math 37% / reading 32%, grade F, #1,709 of 2,144 statewide, top 81%, 737 students, 73% FRL); Hernando High School (math 42% / reading 42%, grade F, #275 of 667 statewide, top 42%, 1,299 students, 58% FRL).
- Watch-outs: flood insurance adds $66/mo.
- Market conditions: 185 active listings in the ZIP; 4 comparable units currently listed for rent nearby; rentals at typical pace (median 25d on market — plan ~3-4 weeks tenant-placement turnaround); 2,505 units permitted in Hernando County in 2024 (318 in 5+ unit buildings).
- Hernando County population projected at +11% by 2050 — modest demand growth; plan on rents tracking national, not racing it.
- 2 sale attempts since 4y ago; this cycle's ask has dropped $29k (13%) from the opening price — seller is motivated, your offer sets the floor, not the list.
- Climate carrying-cost: major flood risk; severe wind risk, 99% chance of damaging wind over 30y; major wildfire risk; extreme-heat days projected 7→24/yr by 2055 (HVAC capex compounding) — expect insurance premiums to compound above CPI over the hold.
- Cap rate 8.9% vs local median 5.4% in Hill 'n Dale — top-decile yield for the area; either an underpriced asset or a hidden risk that comps aren't pricing in. Stress-test before assuming the spread holds.
Questions for listing agent
- It's been on market 156 days. Have you received any prior offers? Is the seller open to a 12% concession, seller financing, or rate buy-down credit?
- Built in 1979 — when were the roof, HVAC, electrical panel, plumbing, and water heater last replaced?
- What's the actual annual flood-insurance premium (NFIP or private), and is the property in a SFHA with mandatory coverage?
- Why hasn't it sold? Are there any deal-killer items the seller is aware of (foundation, flood, title, zoning, code violations)?
- Is there a deadline driving the sale (1031 exchange, divorce, estate, relocation)? That informs how much negotiation room exists.
- What's the average days-on-market for RENTAL listings here right now (not sales)? A rising rental-DOM trend means longer vacancies and softer asking-rent achievability than the comps imply.
- What's the recent tenant-quality profile in this submarket — average credit score on applications, eviction rate, late-payment / NSF rate, and stable-employment percentage? A property-management company in the area should have these aggregated.
- How much new for-sale + rental construction is in the pipeline within 1–3 miles? Heavy new supply typically softens prices + rents 12–24 months out; constrained supply supports both.
CashFlowRE · CFR-X569EH4FZFE06A
· Data 2 days ago
cashflowre.app · 2026-05-29