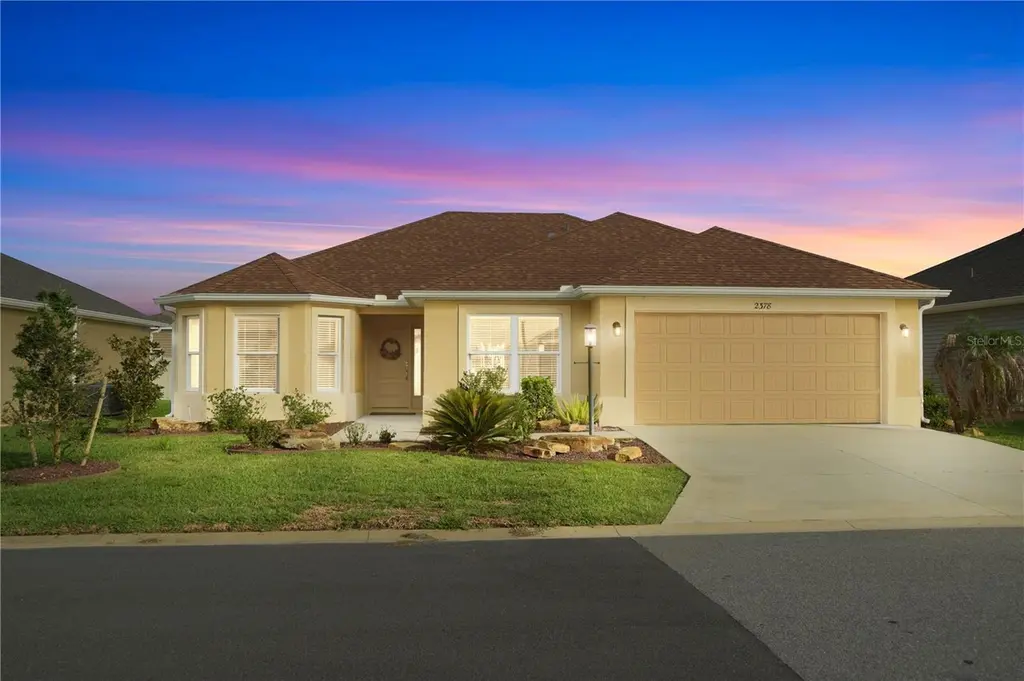
2378 Youngmann Loop
Wildwood, FL 32163
$389,900D
3 bd · 2.0 ba ·
1,611 sqft ·
Built 2022
· SingleFamily
· Active
· 23 DOM
Cashflow @ list (25.0% down · 7.5%)
Estimated rent
$2,660/mo
Mortgage (P&I)
−$2,045
Tax + insurance
−$780
HOA
−$204
Vac / Maint / Mgmt
−$559
Net cashflow
$-927/mo
Annual
$-11,128/yr
Cap rate
3.44%
Cash-on-cash
-10.19%
DSCR
0.55
1% rule
0.68%
Cash to close
$109,172
Investor read
- This is a 3-bed/2.0-bath single-family listed at $390k.
- At list price, monthly cash flow is $-927 ($-11k/yr) — negative.
- To cash-flow at today's rent, offer at most $226k (42.0% below list).
- To meet the 1% rule (rent ≥ 1% of price), the offer needs to be $266k (31.8% below list).
- It's been on market 23 days — a 2% lower offer ($384k) is reasonable based on typical stale-listing flexibility.
- Recommended offer: $226k (42.0% below list) — sets the bar for cash-flow.
- In year one you build about $42k of equity ($3k loan paydown + $39k appreciation (10.0% local appreciation)).
- Location reads 69/100 on livability (#471 in FL) — a middle-class / working-renter tenant base. Strengths: health & safety A+, cost of living A, crime A-; Watch: amenities F, commute F, employment D-.
- Sumter (rural): math 61% / reading 61% proficiency, ranked #11 of 73 in FL (top 15%) — acceptable for families but not a draw, mixed tenant base, ~2y average lease.
- Zoned schools: Wildwood Elementary School (math 49% / reading 52%, grade D+, #1,055 of 2,144 statewide, top 50%, 940 students, 76% FRL); South Sumter Middle School (math 55% / reading 54%, grade B-, #183 of 571 statewide, top 34%, 897 students, 61% FRL) — zoned schools average 68% FRL vs 51% district-wide (18 pts higher); higher-poverty schools than district average — tighter screening recommended.
- Market conditions: 269 active listings in the ZIP; 1 comparable units currently listed for rent nearby; solid renter incomes; 3,961 units permitted in Sumter County in 2024 (248 in 5+ unit buildings).
- Sumter County population projected at +45% by 2050 — long-run rental-demand tailwind backs the buy-and-hold thesis.
- 3 sale attempts with the ask held roughly flat each time — persistent listings suggest the price (not the market) is what's stuck; bring a comps-based counter.
- By year 2, paydown + projected appreciation supports a ~$67k cash-out refi (75% LTV) — recoverable capital for the next deal without selling this one.
- Climate carrying-cost: severe wind risk, 99% chance of damaging wind over 30y; extreme-heat days projected 7→22/yr by 2055 (HVAC capex compounding) — expect insurance premiums to compound above CPI over the hold.
- This rent runs 33% of the median local income ($97k/yr) — at the standard rent-burdened threshold; future hikes will face affordability resistance.
Questions for listing agent
- What do current leases actually rent for vs. the listed asking? Can we see a recent rent roll and the last 12 months of T-12 income?
- What does the HOA fee cover, when was the last increase, and are there any pending special assessments or reserve-fund shortfalls?
- Is there a deadline driving the sale (1031 exchange, divorce, estate, relocation)? That informs how much negotiation room exists.
- The area grade is low — what's the realistic commute time and amenity access for the typical tenant pool here? Any planned neighborhood developments (good or bad) we should know about?
- What's the average days-on-market for RENTAL listings here right now (not sales)? A rising rental-DOM trend means longer vacancies and softer asking-rent achievability than the comps imply.
- What's the recent tenant-quality profile in this submarket — average credit score on applications, eviction rate, late-payment / NSF rate, and stable-employment percentage? A property-management company in the area should have these aggregated.
- How much new for-sale + rental construction is in the pipeline within 1–3 miles? Heavy new supply typically softens prices + rents 12–24 months out; constrained supply supports both.
CashFlowRE · CFR-X5BVZVAW3A38W3
· Data 10 h ago
cashflowre.app · 2026-05-29