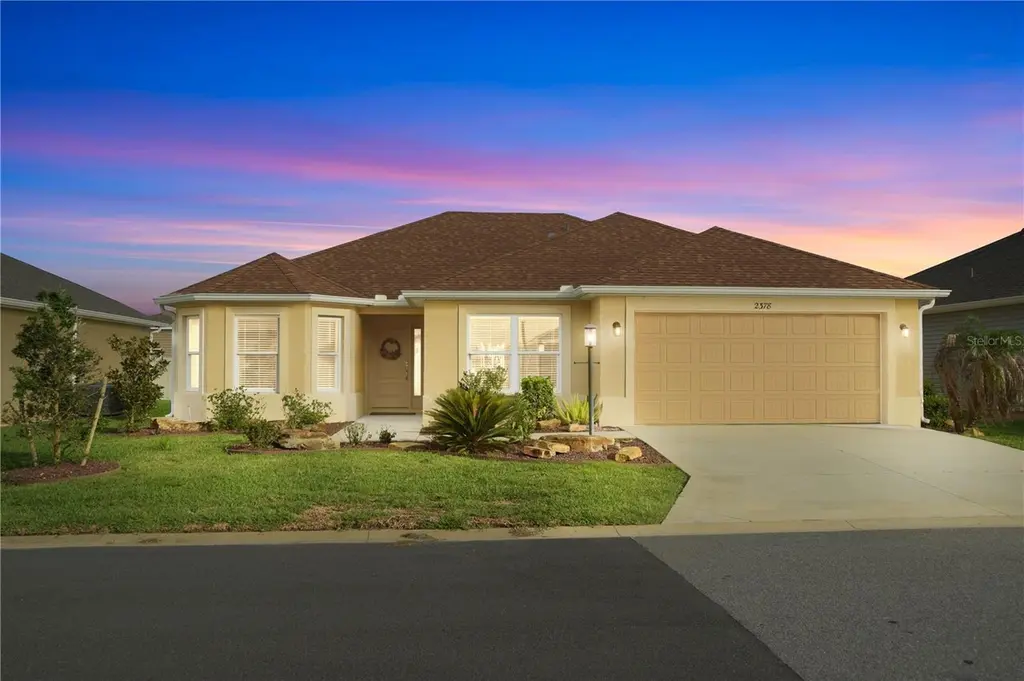
2378 Youngmann Loop · Wildwood, FL
Flood risk 1/10 · Minimal
- FEMA flood zone
- X (unshaded)
- Chance of flooding over 30 yrs
- 0.0%
- Est. flood insurance / yr
- $507 – $1,088
Fire risk 4/10 · Minor
- Est. fire insurance / yr
- $947 – $1,759
Heat risk 8/10 · Major
- Hot days now (above 108°F)
- 7 days/yr
- Hot days in 30 yrs
- 22 days/yr
Wind risk 9/10 · Severe
- Chance of severe wind over 30 yrs
- 99.0%
Air-quality risk 2/10 · Minimal
- Unhealthy air days now
- 1 days/yr
- Unhealthy air days in 30 yrs
- 2 days/yr
Risk factors via First Street. Map © Google.
Why this score? — see what drove the D grade
The composite is a weighted blend of 9 inputs, each scored 0–100. Each bar is that input's sub-score; the figure is the points it added to the 100-point composite (weight × sub-score).
- ARV discount +12.3/15.0
- Appreciation +10.0/10.0
- Schools +5.2/10.0
- Cash flow +4.9/30.0
- Livability +3.5/5.0
- Rent growth +2.5/5.0
- Condition / age +2.5/5.0
- 1% rule +1.8/10.0
- DSCR +0.0/10.0
$389,900
🖨 Deal sheet (PDF) 📄 Offer letter ✓ Due diligence
Listing remarks
Put this house on the top of your list if you're looking for a great house that is only a few years old, well maintained, and has mature landscaping and updates like gutter that all the new homes are lacking. It's a popular Jasmine model perfectly located in the village of St. John's. This ideal location gives you the best of both worlds! You get the newer construction of homes south of Rt 44 plus you are just a quick golf cart ride to Brownwood square! This home has exclusive features like a Roman shower, Samsung appliances, gas stove and even a pocket door that seals off the guest area for privacy. Speaking of privacy, you even have a fence in the backyard, no kissig lanais here! You are
Key facts
- Samsung appliances
- Pocket door
- Gas stove
Tags
Property features AI
Finance
- Other: CDD present
- Financial info: $2,448 annual assessment (approx.); No lease restrictions; Unfurnished
- HOA & community: The Villages homeowners association; HOA required, $204 monthly; Senior community; Pets allowed
Exterior
- Parking: Attached 2-car garage
- Utilities: Public water; Public sewer; Cable connected; Electricity connected; Natural gas connected; Water connected
- Home design: Single-family residence; One level; Faces south
- Construction: Block construction; Shingle roof; Built on slab
- Exterior features: Irrigation equipment; Asphalt road surface; Lot about 0.12 acres (approximate)
Interior
- Kitchen: Dishwasher; Disposal; Microwave; Range; Range hood; Solar hot water
- Bedrooms: 3 bedrooms
- Flooring: Tile; Slab foundation
- Bathrooms: 2 full bathrooms
- Heating & cooling: Central heating; Central air conditioning
- Interior features: Ceiling fans
- Laundry & utility: Washer; Dryer; Laundry inside
Neighborhood map
What this means for you Summary
Snapshot
- This is a 3-bed/2.0-bath single-family listed at $390k.
Deal economics
- At list price, monthly cash flow is $-927 ($-11k/yr) — negative.
- To cash-flow at today's rent, offer at most $226k (42.0% below list).
- To meet the 1% rule (rent ≥ 1% of price), the offer needs to be $266k (31.8% below list).
- Recommended offer: $226k (42.0% below list) — sets the bar for cash-flow.
Location & tenants
- Location reads 69/100 on livability (#471 in FL) — a middle-class / working-renter tenant base. Strengths: health & safety A+, cost of living A, crime A-; Watch: amenities F, commute F, employment D-.
- Sumter (rural): math 61% / reading 61% proficiency, ranked #11 of 73 in FL (top 15%) — acceptable for families but not a draw, mixed tenant base, ~2y average lease.
- Zoned schools: Wildwood Elementary School (math 49% / reading 52%, grade D+, #1,055 of 2,144 statewide, top 50%, 940 students, 76% FRL); South Sumter Middle School (math 55% / reading 54%, grade B-, #183 of 571 statewide, top 34%, 897 students, 61% FRL) — zoned schools average 68% FRL vs 51% district-wide (18 pts higher); higher-poverty schools than district average — tighter screening recommended.
- Market conditions: 269 active listings in the ZIP; 1 comparable units currently listed for rent nearby; solid renter incomes; 3,961 units permitted in Sumter County in 2024 (248 in 5+ unit buildings).
- This rent runs 33% of the median local income ($97k/yr) — at the standard rent-burdened threshold; future hikes will face affordability resistance.
Forward outlook
- In year one you build about $42k of equity ($3k loan paydown + $39k appreciation (10.0% local appreciation)).
- Sumter County population projected at +45% by 2050 — long-run rental-demand tailwind backs the buy-and-hold thesis.
- By year 2, paydown + projected appreciation supports a ~$67k cash-out refi (75% LTV) — recoverable capital for the next deal without selling this one.
Negotiation context
- It's been on market 23 days — a 2% lower offer ($384k) is reasonable based on typical stale-listing flexibility.
- 3 sale attempts with the ask held roughly flat each time — persistent listings suggest the price (not the market) is what's stuck; bring a comps-based counter.
Risks & watch-outs
- Climate carrying-cost: severe wind risk, 99% chance of damaging wind over 30y; extreme-heat days projected 7→22/yr by 2055 (HVAC capex compounding) — expect insurance premiums to compound above CPI over the hold.
Questions for the listing agent
- What do current leases actually rent for vs. the listed asking? Can we see a recent rent roll and the last 12 months of T-12 income?
- What does the HOA fee cover, when was the last increase, and are there any pending special assessments or reserve-fund shortfalls?
- Is there a deadline driving the sale (1031 exchange, divorce, estate, relocation)? That informs how much negotiation room exists.
- The area grade is low — what's the realistic commute time and amenity access for the typical tenant pool here? Any planned neighborhood developments (good or bad) we should know about?
- What's the average days-on-market for RENTAL listings here right now (not sales)? A rising rental-DOM trend means longer vacancies and softer asking-rent achievability than the comps imply.
- What's the recent tenant-quality profile in this submarket — average credit score on applications, eviction rate, late-payment / NSF rate, and stable-employment percentage? A property-management company in the area should have these aggregated.
- How much new for-sale + rental construction is in the pipeline within 1–3 miles? Heavy new supply typically softens prices + rents 12–24 months out; constrained supply supports both.
Investment metrics
- 1% rule
- 0.68% ✗
- Cap rate
- 3.44%
- Cash-on-cash
- -10.19%
- DSCR
- 0.55
- GRM
- 12.2
CMA / ARV
- ARV (on-the-fly)
- $436,581
- Comps found
- 5
Show comp detail 5 sales within ~0.75 mi
| Address | Dist | Beds/Ba | Sqft | Sold | Price | $/sf | Match |
|---|---|---|---|---|---|---|---|
| 4813 Pivanka Ave | 0.08mi | 3/2.0 | 1,440 (-11%) | 14mo | $295,000 | $205 | 67 |
| 4874 Noreen Ct | 0.17mi | 3/2.0 | 1,440 (-11%) | 9mo | $345,000 | $240 | 67 |
| 2585 Constance Ct | 0.29mi | 3/2.0 | 1,730 (+7%) | 11mo | $520,000 | $301 | 65 |
| 4788 Rostas Way | 0.64mi | 3/2.0 | 1,516 (-6%) | 1mo | $500,000 | $330 | 59 |
| 2505 Drew Cir | 0.32mi | 3/2.0 | 1,419 (-12%) | 18mo | $385,000 | $271 | 50 |
Match score weights: distance 35% · size 25% · config 20% · recency 20%. Top-matched comps best support the ARV.
Projected returns pro-forma
10.0% appreciation · 3.0% rent growth · sell at horizon
- IRR
- 17.2%
- Equity multiple
- 2.41×
- Total profit
- $153,535
- Equity at exit
- $351,253
- IRR
- 16.3%
- Equity multiple
- 5.57×
- Total profit
- $499,069
- Equity at exit
- $757,490
Cash invested: $109,172 (down + closing). Projections, not guarantees.
Landlord ↔ Tenant lean methodology
- Overall (STATE)
- 87 Strongly Landlord-Friendly
- State Florida
- 87 Strongly Landlord-Friendly · R+3
- County
- — inherits STATE
- City
- — inherits STATE
ZIP-level market 32163
- Home prices YoY
- 9.8%
- Active inventory
- 269
- Price-to-rent
- 12.2×
Monthly cashflow live
- Estimated rent
- $2,660 medium interval (Pro) →
- Mortgage (P&I)
- −$2,045
- Tax from tax record
- −$618 /mo · $7,410/yr
- Insurance
- −$162
- HOA
- −$204
- Vacancy / Maint / Mgmt
- −$559
- Net cashflow
- $-927
Break-even live
Sensitivity live
| Price | -10% $-707 | -5% $-817 | +0% $-927 | +5% $-1,038 | +10% $-1,148 |
|---|---|---|---|---|---|
| Rent | -10% $-1,137 | -5% $-1,032 | +0% $-927 | +5% $-822 | +10% $-717 |
| Rate | -1.0pp $-731 | -0.5pp $-828 | base $-927 | +0.5pp $-1,028 | +1.0pp $-1,131 |
UW: 25.0% down · 7.5% · 30yr · 1.5% tax · 5.0% vac · 8.0% maint · 8.0% mgmt
Financing live
Cash to close
- Down payment
- $97,475
- Closing costs
- $11,697
- Reserves months
- —
- Total cash needed
- —
Loan-product check · same deal, 3 products live
Conventional
25% down · 7.5% · 30yr
- Down + closing
- —
- Monthly P&I
- —
- Monthly cashflow
- —
- DSCR
- —
- Eligible?
- —
Personal DTI + credit; lowest rate.
DSCR
20% down · 8.5% · 30yr
- Down + closing
- —
- Monthly P&I
- —
- Monthly cashflow
- —
- DSCR
- —
- Eligible?
- —
No personal income docs; deal must DSCR.
Hard money
10% down · 12.0% · 12mo
- Down + closing
- —
- Monthly P&I
- —
- Monthly cashflow
- —
- DSCR
- —
- Eligible?
- —
Short-term bridge; refi at stabilization.
Rent comps 1 comps
| Address | Beds | Baths | Sqft | Rent | $/sqft | DOM | Units | Dist |
|---|---|---|---|---|---|---|---|---|
| 2910 Monument Way The Villages, FL | 2.0 | 2.0 | 1494 | $2,600 | $1.74 | 22d | 1 | 1.45mi |
HOA detail
- Monthly dues
- $204 · $2,448/yr
- Likely covers
- gaslandscaping
Listing history 22 events
-
2026-06-22days on market $389,900 Active 23 DOM
-
2026-06-19days on market $389,900 Active 21 DOM
-
2026-06-18days on market $389,900 Active 20 DOM
-
2026-06-17days on market $389,900 Active 19 DOM
-
2026-06-16days on market $389,900 Active 18 DOM
-
2026-06-15price $389,900 Active 17 DOM
-
2026-06-15days on market $399,900 Active 17 DOM
-
2026-06-14days on market $399,900 Active 15 DOM
-
2026-06-13days on market $399,900 Active 14 DOM
-
2026-06-10days on market $399,900 Active 12 DOM
-
2026-06-09days on market $399,900 Active 11 DOM
-
2026-06-08days on market $399,900 Active 10 DOM
-
2026-06-07days on market $399,900 Active 9 DOM
-
2026-06-02days on market $399,900 Active 4 DOM
-
2026-06-01days on market $399,900 Active 3 DOM
-
2026-05-31days on market $399,900 Active 2 DOM
-
2026-05-29$399,900 Active
-
2026-03-23$399,900 Active
-
2026-03-15historical
-
2026-01-27price $420,000
-
2025-12-20$449,000 Active
-
2024-08-21soldstatus $429,000
ⓘ Source: listings_history table (triggers on properties + properties_extension) + one-shot
backfill from property_details.listing_events for pre-trigger history.
Tax reassessment forecast FL · Resets to sale price
- Current annual tax
- $7,410 · $618/mo
- Projected year-2 tax
- $7,410 · $618/mo
- Expected delta
- $0/yr ($0/mo · 0.0%)
ⓘ Screening estimate from a state-policy table — verify with the county assessor before closing.
Climate risk First Street
- Flood 1/10 Low FEMA zone X (unshaded) · 0% chance over 30 yrs
- Wildfire 4/10 Moderate
- Heat 8/10 Severe 7 d/yr ≥108°F today · 22 d/yr by 30 yrs out
- Wind 9/10 Extreme 99% chance of damaging wind over 30 yrs
- Air quality 2/10 Low 1 unhealthy d/yr today · 2 by 30 yrs out
Nearby sold comps map
Loading sold comps map…
Walkable amenities ~0.75 mi
Loading nearby amenities…
Taxation est. · year 1
- Rental income
- $31,919
- − Mortgage interest
- −$21,840
- − Property taxes
- −$7,410
- − Insurance
- −$1,950
- − Repairs & maintenance
- −$2,554
- − Management
- −$2,554
- − HOA
- −$2,448
- − Depreciation
- −$11,343
- Taxable loss
- −$18,178
- Est. tax savings @ 24.0%
- +$4,363
- After-tax cash flow
- $-6,765/yr
For passive investors: Depreciation is non-cash, so a rental often shows a tax loss while cash-flowing — sheltering income. Rental losses are passive: they offset passive income freely, and up to $25,000/yr can offset ordinary (W-2) income if you actively participate and your MAGI is under $100k (phasing out to $0 by $150k); unused losses carry forward. On sale, claimed depreciation is recaptured at up to 25%, and gains may owe capital-gains tax (a 1031 exchange can defer both). Figures are a year-1 estimate at your 24.0% rate — not tax advice; consult a CPA.
Schools (NCES district)
- District
- Sumter
- NCES district ID
- 1201800
- Math proficiency
- 61% ▼ -4.00%
- Reading proficiency
- 61% ▼ -2.00%
- Median HH income
- $48,240
- Composite
- 51.74/100
- National rank
- #1682
- State rank
- #11 of 73 in FL
Livability — Wildwood
- Score
- 69/100
- State rank
- #471
- US rank
- #8500
Category grades
Schools grade is shown separately in the Schools card above.
Census & demographics
- Census place
- Wildwood, FL
- County
- Sumter County · 110,591 people
- City population
- 21,568
- Metro
- The Villages, FL
- Population (ZIP)
- 28,549
- Household income
- $96,775
- Rent vs Own
- Severe rent burden
- 307.0
Population outlook (Sumter County) Hauer SSP2
- Today (2025)
- 161,172 people
- By 2030
- 180,083 · +11.7%
- By 2040
- 209,892 · +30.2%
- By 2050
- 234,186 · +45.3%
- By 2075
- 284,602 · +76.6%
- By 2100
- 317,039 · +96.7%
Race, ethnicity, and origin ACS 2023
- Neighborhood character
- Predominantly White (95%)
- Race & ethnicity
- White 95% Two or more races 2% Hispanic / Latino 2% Asian 1%
- Common ancestry
- Romanian 6% Lithuanian 3% Iranian 3%
- Foreign-born
- 6% · Canada, Vietnam
- Languages at home
- 96% English-only · Spanish 2% Vietnamese 1% Other Indo-European 0%
Political lean MEDSL · Sumter
- 2024 margin
- Solid R (+37.6) · D 30.9% · R 68.6%
- 2008→2024 swing
- -10.6pp toward R · 2008: -27.0pp · 2024: -37.6pp
- All cycles
- 2024: R+37.6 2020: R+36.1 2016: R+39.2 2012: R+34.9 2008: R+27.0
Not yet ingested
- Civics
- —
Market trends
- HPI YoY
- ▲ 20.47%
- Current HPI
- 229.0075
- Rent YoY
- —
- Metro
- The Villages, FL
- State GDP YoY
- ▲ 3.28%
- F500 in state
- 36
Industry mix (Fortune 500 HQ in FL)
| Industry | F500 HQs | Revenue |
|---|---|---|
| Industrial Technology | 2 | $29B |
|
||
| Insurance | 2 | $17B |
|
||
| Retail | 1 | $60B |
|
||
| Technology Distribution | 1 | $58B |
|
||
| Homebuilding | 1 | $35B |
|
||
| Technology Manufacturing | 1 | $35B |
|
||
Price history
-6.8% since first listed6 events — show timeline
- 2026-05-29 Listed $399,900 Stellar MLS as Distributed by MLS Grid
- 2026-03-23 Listed $399,900 Stellar MLS as Distributed by MLS Grid
- 2026-03-15 Listing Removed — Stellar MLS as Distributed by MLS Grid
- 2026-01-27 Price Changed $420,000 Stellar MLS as Distributed by MLS Grid
- 2025-12-20 Listed $449,000 Stellar MLS as Distributed by MLS Grid
- 2024-08-21 Sold (Public Records) $429,000 Public Records
Property tax history
+34.6%/yrLatest (2025): $7,410 · +11.3% YoY. Source: county tax records.
Cash-flow waterfall
monthlySold comps — $/sqft
last 12 mo · ≤1 miLoading sold comps…