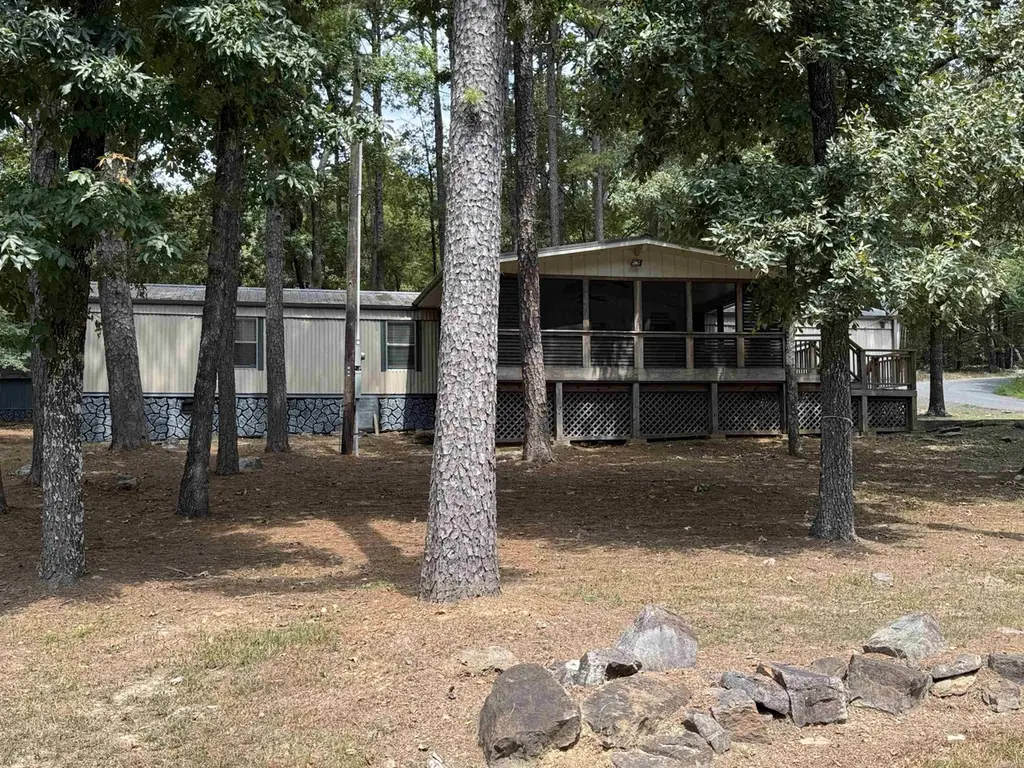
1950 Northshore Dr
Greers Ferry, AR 72067
$158,900D-
3 bd · 1.0 ba ·
1,280 sqft ·
Built 1993
· Manufactured
· Active
· 119 DOM
Cashflow @ list (25.0% down · 7.5%)
Estimated rent
$1,053/mo
Mortgage (P&I)
−$833
Tax + insurance
−$265
HOA
−$0
Vac / Maint / Mgmt
−$221
Net cashflow
$-266/mo
Annual
$-3,196/yr
Cap rate
4.28%
Cash-on-cash
-7.18%
DSCR
0.68
1% rule
0.66%
Cash to close
$44,492
Investor read
- This is a 3-bed/1.0-bath manufactured listed at $159k.
- At list price, monthly cash flow is $-266 ($-3k/yr) — negative.
- To cash-flow at today's rent, offer at most $120k (24.3% below list).
- To meet the 1% rule (rent ≥ 1% of price), the offer needs to be $105k (33.7% below list).
- It's been on market 119 days — a 9% lower offer ($145k) is reasonable based on typical stale-listing flexibility.
- Recommended offer: $105k (33.7% below list) — sets the bar for 1% rule.
- In year one you build about $13k of equity ($1k loan paydown + $12k appreciation (7.6% local appreciation)).
- Location reads 61/100 on livability (#251 in AR) — a middle-class / working-renter tenant base. Strengths: cost of living A+, housing A+; Watch: employment D+, schools D, amenities F.
- West Side School District (rural): math 29% / reading 41% proficiency, ranked #118 of 238 in AR (top 50%) — families likely to look elsewhere, expect single-tenant / working-renter base with shorter leases.
- Market conditions: 165 active listings in the ZIP; 13 units permitted in Cleburne County in 2024 (0 in 5+ unit buildings).
- Cleburne County population projected at -18% by 2050 — secular population decline; favor cash flow + early exit over multi-decade hold.
- 3 sale attempts since 17y ago with the ask held roughly flat each time — persistent listings suggest the price (not the market) is what's stuck; bring a comps-based counter.
- Current owner paid $78k; list at $159k implies a 104% gain — meaningful room to come down on a strong offer.
- By year 3, paydown + projected appreciation supports a ~$33k cash-out refi (75% LTV) — recoverable capital for the next deal without selling this one.
- Climate carrying-cost: moderate wildfire risk; extreme-heat days projected 7→19/yr by 2055 (HVAC capex compounding) — expect insurance premiums to compound above CPI over the hold.
- Cap rate 4.3% vs local median 1.8% in Greers Ferry — top-decile yield for the area; either an underpriced asset or a hidden risk that comps aren't pricing in. Stress-test before assuming the spread holds.
Questions for listing agent
- What do current leases actually rent for vs. the listed asking? Can we see a recent rent roll and the last 12 months of T-12 income?
- It's been on market 119 days. Have you received any prior offers? Is the seller open to a 34% concession, seller financing, or rate buy-down credit?
- Why hasn't it sold? Are there any deal-killer items the seller is aware of (foundation, flood, title, zoning, code violations)?
- Is there a deadline driving the sale (1031 exchange, divorce, estate, relocation)? That informs how much negotiation room exists.
- Schools are D-rated, which usually means shorter tenancies and higher turnover. Who's the typical renter profile here, and what's been the actual vacancy rate?
- The area grade is low — what's the realistic commute time and amenity access for the typical tenant pool here? Any planned neighborhood developments (good or bad) we should know about?
- What's the average days-on-market for RENTAL listings here right now (not sales)? A rising rental-DOM trend means longer vacancies and softer asking-rent achievability than the comps imply.
- What's the recent tenant-quality profile in this submarket — average credit score on applications, eviction rate, late-payment / NSF rate, and stable-employment percentage? A property-management company in the area should have these aggregated.
CashFlowRE · CFR-X68AYBA2YG4H25
· Data 1 day ago
cashflowre.app · 2026-05-29