1950 Northshore Dr · Greers Ferry, AR
Flood risk 1/10 · Minimal
- FEMA flood zone
- X (unshaded)
- Chance of flooding over 30 yrs
- 0.0%
- Est. flood insurance / yr
- $507 – $1,088
Fire risk 5/10 · Moderate
- Est. fire insurance / yr
- $1,499 – $2,785
Heat risk 5/10 · Moderate
- Hot days now (above 109°F)
- 7 days/yr
- Hot days in 30 yrs
- 19 days/yr
Wind risk 3/10 · Minor
- Chance of severe wind over 30 yrs
- 5.0%
Air-quality risk 2/10 · Minimal
- Unhealthy air days now
- 0 days/yr
- Unhealthy air days in 30 yrs
- 1 days/yr
Risk factors via First Street. Map © Google.
Why this score? — see what drove the D- grade
The composite is a weighted blend of 9 inputs, each scored 0–100. Each bar is that input's sub-score; the figure is the points it added to the 100-point composite (weight × sub-score).
- Appreciation +8.8/10.0
- ARV discount +7.5/15.0
- Cash flow +6.5/30.0
- Livability +3.1/5.0
- Schools +2.9/10.0
- Rent growth +2.5/5.0
- Condition / age +2.5/5.0
- 1% rule +1.6/10.0
- DSCR +0.8/10.0
$158,900
🖨 Deal sheet 📄 Offer letter ✓ Due diligence
Listing remarks MLS
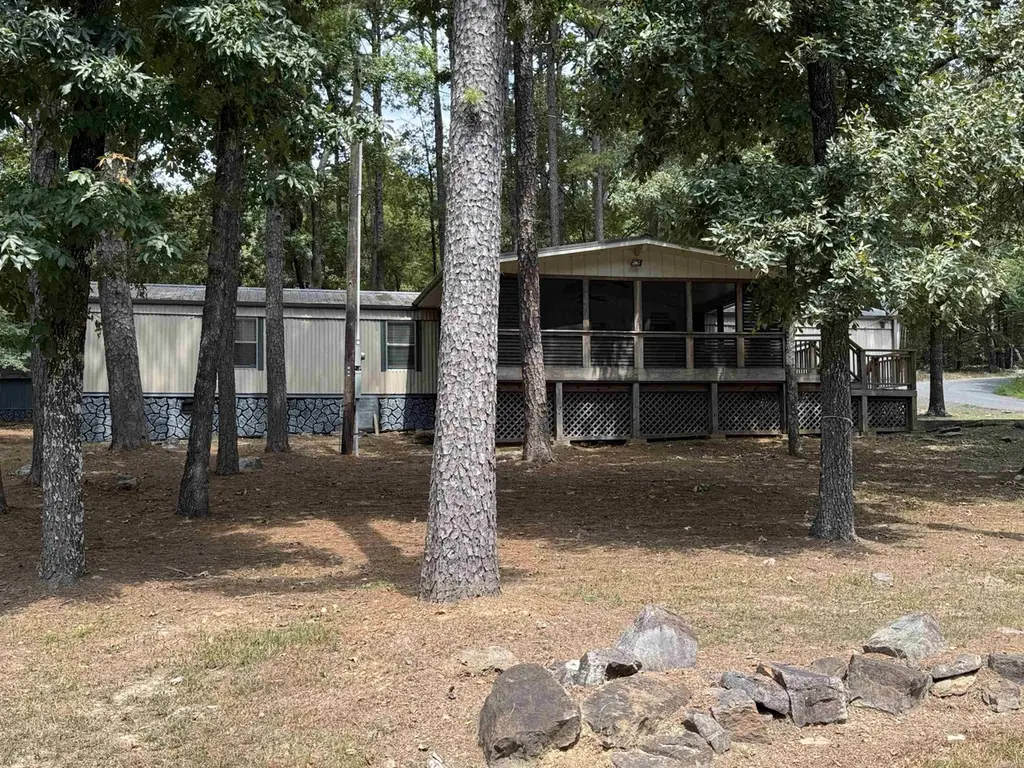
PERFECT LAKE VIEW CORNER LOT. This home is all electric with 3 bedroom 2 bath and comes with most furnishings. It sits on a . 49 wooded lot with concrete driveway and a storage shed. Great area for permanent or a vacation home. Awesome covered screened front porch is super large for all your entertaining. Call Today !!
Key facts
- Wooded lot
- Lake view
- Storage shed
Tags
Neighborhood map
What this means for you Summary
Snapshot
- This is a 3-bed/1.0-bath manufactured listed at $159k.
Deal economics
- At list price, monthly cash flow is $-266 ($-3k/yr) — negative.
- To cash-flow at today's rent, offer at most $120k (24.3% below list).
- To meet the 1% rule (rent ≥ 1% of price), the offer needs to be $105k (33.7% below list).
- Recommended offer: $105k (33.7% below list) — sets the bar for 1% rule.
- Cap rate 4.3% vs local median 1.8% in Greers Ferry — top-decile yield for the area; either an underpriced asset or a hidden risk that comps aren't pricing in. Stress-test before assuming the spread holds.
Location & tenants
- Location reads 61/100 on livability (#251 in AR) — a middle-class / working-renter tenant base. Strengths: cost of living A+, housing A+; Watch: employment D+, schools D, amenities F.
- West Side School District (rural): math 29% / reading 41% proficiency, ranked #118 of 238 in AR (top 50%) — families likely to look elsewhere, expect single-tenant / working-renter base with shorter leases.
- Market conditions: 165 active listings in the ZIP; 13 units permitted in Cleburne County in 2024 (0 in 5+ unit buildings).
Forward outlook
- In year one you build about $13k of equity ($1k loan paydown + $12k appreciation (7.6% local appreciation)).
- Cleburne County population projected at -18% by 2050 — secular population decline; favor cash flow + early exit over multi-decade hold.
- By year 3, paydown + projected appreciation supports a ~$33k cash-out refi (75% LTV) — recoverable capital for the next deal without selling this one.
Negotiation context
- It's been on market 119 days — a 9% lower offer ($145k) is reasonable based on typical stale-listing flexibility.
- 3 sale attempts since 17y ago with the ask held roughly flat each time — persistent listings suggest the price (not the market) is what's stuck; bring a comps-based counter.
- Current owner paid $78k; list at $159k implies a 104% gain — meaningful room to come down on a strong offer.
Risks & watch-outs
- Climate carrying-cost: moderate wildfire risk; extreme-heat days projected 7→19/yr by 2055 (HVAC capex compounding) — expect insurance premiums to compound above CPI over the hold.
Questions for the listing agent
- What do current leases actually rent for vs. the listed asking? Can we see a recent rent roll and the last 12 months of T-12 income?
- It's been on market 119 days. Have you received any prior offers? Is the seller open to a 34% concession, seller financing, or rate buy-down credit?
- Why hasn't it sold? Are there any deal-killer items the seller is aware of (foundation, flood, title, zoning, code violations)?
- Is there a deadline driving the sale (1031 exchange, divorce, estate, relocation)? That informs how much negotiation room exists.
- Schools are D-rated, which usually means shorter tenancies and higher turnover. Who's the typical renter profile here, and what's been the actual vacancy rate?
- The area grade is low — what's the realistic commute time and amenity access for the typical tenant pool here? Any planned neighborhood developments (good or bad) we should know about?
- What's the average days-on-market for RENTAL listings here right now (not sales)? A rising rental-DOM trend means longer vacancies and softer asking-rent achievability than the comps imply.
- What's the recent tenant-quality profile in this submarket — average credit score on applications, eviction rate, late-payment / NSF rate, and stable-employment percentage? A property-management company in the area should have these aggregated.
- How much new for-sale + rental construction is in the pipeline within 1–3 miles? Heavy new supply typically softens prices + rents 12–24 months out; constrained supply supports both.
Investment metrics
- 1% rule
- 0.66% ✗
- Cap rate
- 4.28%
- Cash-on-cash
- -7.18%
- DSCR
- 0.68
- GRM
- 12.6
CMA / ARV
- ARV (median comp)
- $62,544
- List price
- $158,900
- Delta
- 154.06%
- Verdict
- OVERPRICED
- Comps
- 2 within 2.0 mi
Projected returns pro-forma
7.59% appreciation · 3.0% rent growth · sell at horizon
- IRR
- 13.6%
- Equity multiple
- 2.00×
- Total profit
- $44,371
- Equity at exit
- $116,318
- IRR
- 13.8%
- Equity multiple
- 4.18×
- Total profit
- $141,330
- Equity at exit
- $226,812
Cash invested: $44,492 (down + closing). Projections, not guarantees.
Landlord ↔ Tenant lean methodology
- Overall (STATE)
- 92 Strongly Landlord-Friendly
- State Arkansas
- 92 Strongly Landlord-Friendly · R+14
- County
- — inherits STATE
- City
- — inherits STATE
ZIP-level market 72067
- Home prices YoY
- 3.2%
- Active inventory
- 165
- Price-to-rent
- 12.6×
Monthly cashflow live
- Estimated rent
- $1,053 medium interval (Pro) →
- Mortgage (P&I)
- −$833
- Tax est. 1.5%
- −$199 /mo · $2,384/yr
- Insurance
- −$66
- HOA
- −$0
- Vacancy / Maint / Mgmt
- −$221
- Net cashflow
- $-266
Break-even live
UW: 25.0% down · 7.5% · 30yr · 1.5% tax · 5.0% vac · 8.0% maint · 8.0% mgmt
Financing live
Cash to close
- Down payment
- $39,725
- Closing costs
- $4,767
- Reserves months
- —
- Total cash needed
- —
Loan-product check · same deal, 3 products live
Conventional
25% down · 7.5% · 30yr
- Down + closing
- —
- Monthly P&I
- —
- Monthly cashflow
- —
- DSCR
- —
- Eligible?
- —
Personal DTI + credit; lowest rate.
DSCR
20% down · 8.5% · 30yr
- Down + closing
- —
- Monthly P&I
- —
- Monthly cashflow
- —
- DSCR
- —
- Eligible?
- —
No personal income docs; deal must DSCR.
Hard money
10% down · 12.0% · 12mo
- Down + closing
- —
- Monthly P&I
- —
- Monthly cashflow
- —
- DSCR
- —
- Eligible?
- —
Short-term bridge; refi at stabilization.
Listing history 24 events
-
2026-06-19days on market $158,900 Active 119 DOM
-
2026-06-18days on market $158,900 Active 118 DOM
-
2026-06-17days on market $158,900 Active 117 DOM
-
2026-06-16days on market $158,900 Active 116 DOM
-
2026-06-15days on market $158,900 Active 115 DOM
-
2026-06-14days on market $158,900 Active 113 DOM
-
2026-06-12days on market $158,900 Active 112 DOM
-
2026-06-09days on market $158,900 Active 109 DOM
-
2026-06-08days on market $158,900 Active 108 DOM
-
2026-06-07days on market $158,900 Active 107 DOM
-
2026-06-07days on market $158,900 Active 106 DOM
-
2026-06-04days on market $158,900 Active 103 DOM
-
2026-06-02days on market $158,900 Active 102 DOM
-
2026-06-01days on market $158,900 Active 101 DOM
-
2026-05-31days on market $158,900 Active 100 DOM
-
2026-05-31days on market $158,900 Active 99 DOM
-
2026-02-20$158,900 New Listing 321-char remark
Show marketing remark (321 chars)
PERFECT LAKE VIEW CORNER LOT. This home is all electric with 3 bedroom 2 bath and comes with most furnishings. It sits on a . 49 wooded lot with concrete driveway and a storage shed. Great area for permanent or a vacation home. Awesome covered screened front porch is super large for all your entertaining. Call Today !!
-
2026-02-19historical
-
2025-08-18$158,900 New Listing
-
2010-08-06soldstatus $78,000
-
2010-08-06soldstatus $78,000
-
2010-07-22historical
-
2009-08-14$92,000
-
1985-08-13soldstatus $15,000
ⓘ Source: listings_history table (triggers on properties + properties_extension) + one-shot
backfill from property_details.listing_events for pre-trigger history.
Climate risk First Street
- Flood 1/10 Low FEMA zone X (unshaded) · 0% chance over 30 yrs
- Wildfire 5/10 Major
- Heat 5/10 Major 7 d/yr ≥109°F today · 19 d/yr by 30 yrs out
- Wind 3/10 Moderate 5% chance of damaging wind over 30 yrs
- Air quality 2/10 Low 0 unhealthy d/yr today · 1 by 30 yrs out
Nearby sold comps map
Loading sold comps map…
Walkable amenities ~0.75 mi
Loading nearby amenities…
Taxation est. · year 1
- Rental income
- $12,634
- − Mortgage interest
- −$8,901
- − Property taxes
- −$2,384
- − Insurance
- −$794
- − Repairs & maintenance
- −$1,011
- − Management
- −$1,011
- − Depreciation
- −$4,623
- Taxable loss
- −$6,088
- Est. tax savings @ 24.0%
- +$1,461
- After-tax cash flow
- $-1,735/yr
For passive investors: Depreciation is non-cash, so a rental often shows a tax loss while cash-flowing — sheltering income. Rental losses are passive: they offset passive income freely, and up to $25,000/yr can offset ordinary (W-2) income if you actively participate and your MAGI is under $100k (phasing out to $0 by $150k); unused losses carry forward. On sale, claimed depreciation is recaptured at up to 25%, and gains may owe capital-gains tax (a 1031 exchange can defer both). Figures are a year-1 estimate at your 24.0% rate — not tax advice; consult a CPA.
Schools (NCES district)
- District
- West Side School District
- NCES district ID
- 0514040
- Math proficiency
- 29% ▼ -6.00%
- Reading proficiency
- 41% ▼ -6.00%
- Median HH income
- $39,658
- Composite
- 29.31/100
- National rank
- #6551
- State rank
- #118 of 238 in AR
Livability — Greers Ferry
- Score
- 61/100
- State rank
- #251
- US rank
- #18144
Category grades
Schools grade is shown separately in the Schools card above.
Census & demographics
- City population
- 2,881
- Population (ZIP)
- 2,881
Population outlook (Cleburne County) Hauer SSP2
- Today (2025)
- 24,198 people
- By 2030
- 23,324 · -3.6%
- By 2040
- 21,566 · -10.9%
- By 2050
- 19,916 · -17.7%
- By 2075
- 16,744 · -30.8%
- By 2100
- 13,303 · -45.0%
Race, ethnicity, and origin ACS 2023
- Neighborhood character
- Predominantly White (92%)
- Race & ethnicity
- White 92% Two or more races 7% Hispanic / Latino 2%
- Common ancestry
- Slovak 4% Serbian 3% Iranian 1%
- Foreign-born
- 0%
Political lean MEDSL · Cleburne
- 2024 margin
- Solid R (+67.9) · D 15.2% · R 83.2% · Other 1.6%
- 2008→2024 swing
- -23.7pp toward R · 2008: -44.2pp · 2024: -67.9pp
- All cycles
- 2024: R+67.9 2020: R+65.8 2016: R+61.4 2012: R+52.2 2008: R+44.2
Not yet ingested
- Civics
- —
Market trends
- HPI YoY
- ▲ 7.59%
- Current HPI
- 245.97
- Rent YoY
- —
- Metro
- —
- State GDP YoY
- ▲ 3.80%
- F500 in state
- 10
Industry mix (Fortune 500 HQ in AR)
| Industry | F500 HQs | Revenue |
|---|---|---|
| Retail | 1 | $681B |
|
||
| Food / Agriculture | 1 | $53B |
|
||
| Retail / Energy | 1 | $22B |
|
||
| Transportation / Logistics | 1 | $12B |
|
||
| Energy | 1 | $4B |
|
||
Price history
+959.3% since first listed8 events — show timeline
- 2026-02-20 Listed $158,900 CARMLS
- 2026-02-19 Listing Removed — CARMLS
- 2025-08-18 Listed $158,900 CARMLS
- 2010-08-06 Sold (Public Records) $78,000 Public Records
- 2010-08-06 Sold (MLS) $78,000 CARMLS
- 2010-07-22 Listing Removed — CARMLS
- 2009-08-14 Listed $92,000 CARMLS
- 1985-08-13 Sold (Public Records) $15,000 Public Records
Property tax history
+3.0%/yrLatest (2025): $276 · +10.0% YoY. Source: county tax records.
Cash-flow waterfall
monthlySold comps — $/sqft
last 12 mo · ≤1 miLoading sold comps…