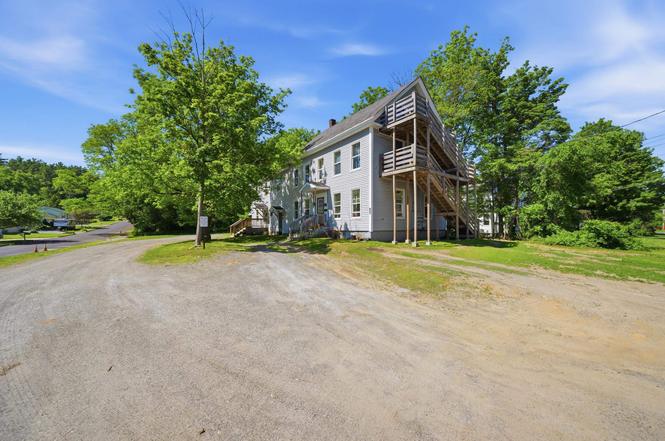
35 South St
Claremont, NH 03743
$650,000C+
9 bd · 4.0 ba ·
3,596 sqft ·
Built 1935
· MultiFamily
· Active
· 2 DOM
Cashflow @ list (25.0% down · 7.5%)
Estimated rent
$7,559/mo
Mortgage (P&I)
−$3,409
Tax + insurance
−$1,131
HOA
−$0
Vac / Maint / Mgmt
−$1,587
Net cashflow
$1,432/mo
Annual
$17,179/yr
Cap rate
8.94%
Cash-on-cash
9.44%
DSCR
1.42
1% rule
1.16%
Cash to close
$182,000
Investor read
- This is a 4 × 3-bed/1.0-bath units multifamily listed at $650k.
- At list price, monthly cash flow is $1k ($17k/yr) — positive. Per door: $358/mo.
- The deal already cash-flows at list — no discount required.
- Meets the 1% rule at list price ($8k rent vs $650k).
- Only 2 days on market — expect competitive offers; lowballing is unlikely to land.
- In year one you build about $6k of equity ($4k loan paydown + $1k appreciation (0.2% local appreciation)).
- Location reads 69/100 on livability (#50 in NH) — a middle-class / working-renter tenant base. Strengths: cost of living A+, health & safety A+, housing A; Watch: employment C-, schools D-, amenities F.
- Claremont School District (town): math 24% / reading 35% proficiency, ranked #85 of 98 in NH (top 87%) — low school quality limits family demand, transient renter base, plan for 1-2y turnover.
- Watch-outs: built in 1935 — expect roof / HVAC / electrical / plumbing capex.
- Market conditions: 58 active listings in the ZIP; 98 units permitted in Sullivan County in 2024 (0 in 5+ unit buildings).
- Sullivan County population projected at -20% by 2050 — secular population decline; favor cash flow + early exit over multi-decade hold.
- 3 sale attempts since 6y ago with the ask held roughly flat each time — persistent listings suggest the price (not the market) is what's stuck; bring a comps-based counter.
- At projected returns (0.2% appreciation + 3.0% rent growth), your $182k cash investment doubles in ~7 years — after that, you're playing with house money.
- By year 6, paydown + projected appreciation supports a ~$39k cash-out refi (75% LTV) — recoverable capital for the next deal without selling this one.
- Cap rate 8.9% vs local median 3.2% in Claremont — top-decile yield for the area; either an underpriced asset or a hidden risk that comps aren't pricing in. Stress-test before assuming the spread holds.
- At $7,559/mo this rent would consume 152% of the median local household income ($60k/yr) (locally 642% of renters already pay >50% of income on rent) — very limited rent-growth headroom before tenants either downsize or default.
Questions for listing agent
- Can we see the unit-by-unit rent roll, current vacancy, and any below-market leases? What's the average tenancy length?
- What capital expenditures (roof, boiler, parking lot, exteriors) have been made in the last 5 years, and what's planned in the next 2?
- Built in 1935 — when were the roof, HVAC, electrical panel, plumbing, and water heater last replaced?
- Is there a deadline driving the sale (1031 exchange, divorce, estate, relocation)? That informs how much negotiation room exists.
- Schools are D-rated, which usually means shorter tenancies and higher turnover. Who's the typical renter profile here, and what's been the actual vacancy rate?
- What's the average days-on-market for RENTAL listings here right now (not sales)? A rising rental-DOM trend means longer vacancies and softer asking-rent achievability than the comps imply.
- What's the recent tenant-quality profile in this submarket — average credit score on applications, eviction rate, late-payment / NSF rate, and stable-employment percentage? A property-management company in the area should have these aggregated.
- How much new apartment / multifamily construction is in the pipeline within 1–3 miles? Heavy new supply (>2% of stock underway) typically softens rents 12–24 months out; light construction supports rent growth.
CashFlowRE · CFR-X745C69S9HTYXQ
· Data 1 day ago
cashflowre.app · 2026-05-29