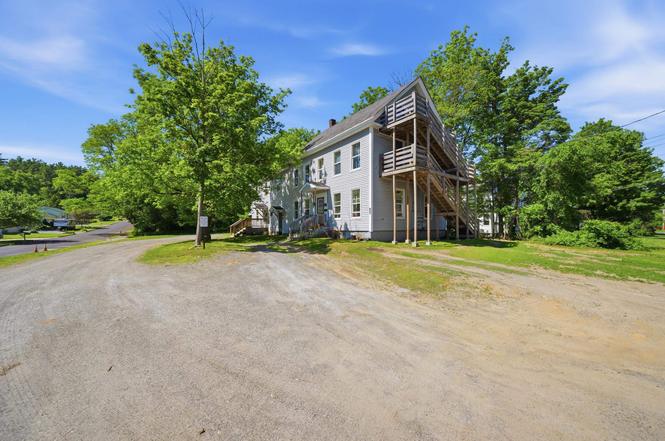
 Fourplex
35 South St · Claremont, NH
Flood risk 1/10 · Minimal
- FEMA flood zone
- X (unshaded)
- Chance of flooding over 30 yrs
- 0.0%
- Est. flood insurance / yr
- $473 – $860
Fire risk 1/10 · Minimal
- Est. fire insurance / yr
- $507 – $941
Heat risk 3/10 · Minor
- Hot days now (above 92°F)
- 7 days/yr
- Hot days in 30 yrs
- 17 days/yr
Wind risk 3/10 · Minor
- Chance of severe wind over 30 yrs
- 7.0%
Air-quality risk 1/10 · Minimal
- Unhealthy air days now
- 0 days/yr
- Unhealthy air days in 30 yrs
- 0 days/yr
Risk factors via First Street. Map © Google.
Why this score? — see what drove the C+ grade
The composite is a weighted blend of 9 inputs, each scored 0–100. Each bar is that input's sub-score; the figure is the points it added to the 100-point composite (weight × sub-score).
- Cash flow +25.1/30.0
- DSCR +8.2/10.0
- ARV discount +7.5/15.0
- 1% rule +6.6/10.0
- Appreciation +5.1/10.0
- Livability +3.5/5.0
- Rent growth +2.5/5.0
- Schools +2.5/10.0
- Condition / age +2.5/5.0
$650,000
🖨 Deal sheet 📄 Offer letter ✓ Due diligence
Multi-family units
County records classify this as Multi-Family (5+ Unit). Listing-text estimate: 4 units. estimate disagrees with records
5+ unit building — per-unit beds/baths from public records are typically unavailable; the breakdown below (if shown) is an estimate from the listing text.
Listing remarks MLS
Own this building for zero cost per month and live for free and collect and income as well if you are an owner occupied property or . .. . Put money in you pocket every month. Low down FHA financing available. Gross current annual income of $46,950; Total Operating Expenses of $28,010 actual for 2019. Net Operating Income (NOI) of $18,940.00 Plenty of parking. Professional managed and in good condition. Buildings are 100% occupied with written leases in place. if you wish to occupy lease renewal is optional. The heat is included in rents. The heating expense should drop as this fall and winter as all the units were converted from tenant controlled thermostat to landlord controlled. .. Visit this web site to view how they operate. (the attached income and expense sheet are complete and easy to read. Includes actual expenses for calendar year 2019. The income calculation are based on current lease income. )
Key facts
- New plumbing lines
- New 100-amp panels
- Generously sized lot
Tags
Property features AI
Finance
- Financial info: Four-unit property with annual leases
Exterior
- Parking: Gravel driveway parking
- Utilities: Public water; Public sewer; 100 Amp electrical service with circuit breakers; Cable available; High-speed internet available; Utilities vary by unit
- Home design: Multi-family building; Existing property; Stone exterior color
- Construction: Wood frame construction; Asphalt shingle roof; Built in 1935; Unfinished basement
- Exterior features: City lot; Gravel driveway; Public street frontage
Interior
- Bedrooms: Unit 1: 3 bedrooms (level 1); Unit 2: 1 bedroom (level 2); Unit 3: 4 bedrooms; Unit 4: 3 bedrooms
- Bathrooms: Four full bathrooms (one in each unit)
- Heating & cooling: Oil-fired hot water heating; No central cooling
- Interior features: Unfinished walk-up basement
Neighborhood map
What this means for you Summary
Snapshot
- This is a 4 × 3-bed/1.0-bath units multifamily listed at $650k.
Deal economics
- At list price, monthly cash flow is $1k ($17k/yr) — positive. Per door: $358/mo.
- The deal already cash-flows at list — no discount required.
- Meets the 1% rule at list price ($8k rent vs $650k).
- Cap rate 8.9% vs local median 3.2% in Claremont — top-decile yield for the area; either an underpriced asset or a hidden risk that comps aren't pricing in. Stress-test before assuming the spread holds.
Location & tenants
- Location reads 69/100 on livability (#50 in NH) — a middle-class / working-renter tenant base. Strengths: cost of living A+, health & safety A+, housing A; Watch: employment C-, schools D-, amenities F.
- Claremont School District (town): math 24% / reading 35% proficiency, ranked #85 of 98 in NH (top 87%) — low school quality limits family demand, transient renter base, plan for 1-2y turnover.
- Market conditions: 58 active listings in the ZIP; 98 units permitted in Sullivan County in 2024 (0 in 5+ unit buildings).
- At $7,559/mo this rent would consume 152% of the median local household income ($60k/yr) (locally 642% of renters already pay >50% of income on rent) — very limited rent-growth headroom before tenants either downsize or default.
Forward outlook
- In year one you build about $6k of equity ($4k loan paydown + $1k appreciation (0.2% local appreciation)).
- Sullivan County population projected at -20% by 2050 — secular population decline; favor cash flow + early exit over multi-decade hold.
- At projected returns (0.2% appreciation + 3.0% rent growth), your $182k cash investment doubles in ~7 years — after that, you're playing with house money.
- By year 6, paydown + projected appreciation supports a ~$39k cash-out refi (75% LTV) — recoverable capital for the next deal without selling this one.
Negotiation context
- Only 2 days on market — expect competitive offers; lowballing is unlikely to land.
- 3 sale attempts since 6y ago with the ask held roughly flat each time — persistent listings suggest the price (not the market) is what's stuck; bring a comps-based counter.
Risks & watch-outs
- Watch-outs: built in 1935 — expect roof / HVAC / electrical / plumbing capex.
Questions for the listing agent
- Can we see the unit-by-unit rent roll, current vacancy, and any below-market leases? What's the average tenancy length?
- What capital expenditures (roof, boiler, parking lot, exteriors) have been made in the last 5 years, and what's planned in the next 2?
- Built in 1935 — when were the roof, HVAC, electrical panel, plumbing, and water heater last replaced?
- Is there a deadline driving the sale (1031 exchange, divorce, estate, relocation)? That informs how much negotiation room exists.
- Schools are D-rated, which usually means shorter tenancies and higher turnover. Who's the typical renter profile here, and what's been the actual vacancy rate?
- What's the average days-on-market for RENTAL listings here right now (not sales)? A rising rental-DOM trend means longer vacancies and softer asking-rent achievability than the comps imply.
- What's the recent tenant-quality profile in this submarket — average credit score on applications, eviction rate, late-payment / NSF rate, and stable-employment percentage? A property-management company in the area should have these aggregated.
- How much new apartment / multifamily construction is in the pipeline within 1–3 miles? Heavy new supply (>2% of stock underway) typically softens rents 12–24 months out; light construction supports rent growth.
Investment metrics
- 1% rule
- 1.16% ✓
- Cap rate
- 8.94%
- Cash-on-cash
- 9.44%
- DSCR
- 1.42
- GRM
- 7.2
CMA / ARV
- ARV (on-the-fly)
- $298,468
- Comps found
- 1
Show comp detail 1 sale within ~0.75 mi
| Address | Dist | Beds/Ba | Sqft | Sold | Price | $/sf | Match |
|---|---|---|---|---|---|---|---|
| 47 Walnut St | 0.49mi | 8/— (-1) | 3,072 (-15%) | 17mo | $255,000 | $83 | 34 |
Match score weights: distance 35% · size 25% · config 20% · recency 20%. Top-matched comps best support the ARV.
Projected returns pro-forma
0.2% appreciation · 3.0% rent growth · sell at horizon
- IRR
- 8.9%
- Equity multiple
- 1.43×
- Total profit
- $78,493
- Equity at exit
- $195,318
- IRR
- 13.7%
- Equity multiple
- 2.53×
- Total profit
- $278,661
- Equity at exit
- $240,098
Cash invested: $182,000 (down + closing). Projections, not guarantees.
Landlord ↔ Tenant lean methodology
- Overall (STATE)
- 56 Moderately Landlord-Leaning
- State New Hampshire
- 56 Moderately Landlord-Leaning · D+1
- County
- — inherits STATE
- City
- — inherits STATE
ZIP-level market 03743
- Home prices YoY
- 0.1%
- Active inventory
- 58
- Price-to-rent
- 28.7×
Monthly cashflow live
- Estimated rent
- $7,559 medium interval (Pro) →
- Mortgage (P&I)
- −$3,409
- Tax from tax record
- −$860 /mo · $10,326/yr
- Insurance
- −$271
- HOA
- −$0
- Vacancy / Maint / Mgmt
- −$1,587
- Net cashflow
- $1,432
Break-even live
4-unit breakdown (identical units grouped — click to expand)
| Units | Beds | Baths | Est. rent |
|---|---|---|---|
| 4× units | 3 | 1 | $7,560 |
| #1 | 3 | 1 | $1,890 |
| #2 | 3 | 1 | $1,890 |
| #3 | 3 | 1 | $1,890 |
| #4 | 3 | 1 | $1,890 |
| Total (4 units) | $7,559 | ||
UW: 25.0% down · 7.5% · 30yr · 1.5% tax · 5.0% vac · 8.0% maint · 8.0% mgmt
Financing live
Cash to close
- Down payment
- $162,500
- Closing costs
- $19,500
- Reserves months
- —
- Total cash needed
- —
Loan-product check · same deal, 3 products live
Conventional
25% down · 7.5% · 30yr
- Down + closing
- —
- Monthly P&I
- —
- Monthly cashflow
- —
- DSCR
- —
- Eligible?
- —
Personal DTI + credit; lowest rate.
DSCR
20% down · 8.5% · 30yr
- Down + closing
- —
- Monthly P&I
- —
- Monthly cashflow
- —
- DSCR
- —
- Eligible?
- —
No personal income docs; deal must DSCR.
Hard money
10% down · 12.0% · 12mo
- Down + closing
- —
- Monthly P&I
- —
- Monthly cashflow
- —
- DSCR
- —
- Eligible?
- —
Short-term bridge; refi at stabilization.
Listing history 3 events
-
2026-06-19days on market $650,000 Active 2 DOM
-
2026-06-18remarks 692-char remark
-
2026-06-18$650,000 Active 1 DOM
ⓘ Source: listings_history table (triggers on properties + properties_extension) + one-shot
backfill from property_details.listing_events for pre-trigger history.
Tax reassessment forecast NH · Partial reset (capped growth)
- Current annual tax
- $10,326 · $860/mo
- Projected year-2 tax
- $12,248 · $1,021/mo
- Expected delta
- +$1,922/yr (+$160/mo · 18.6%)
ⓘ Screening estimate from a state-policy table — verify with the county assessor before closing.
Climate risk First Street
- Flood 1/10 Low FEMA zone X (unshaded) · 0% chance over 30 yrs
- Wildfire 1/10 Low
- Heat 3/10 Moderate 7 d/yr ≥92°F today · 17 d/yr by 30 yrs out
- Wind 3/10 Moderate 7% chance of damaging wind over 30 yrs
- Air quality 1/10 Low 0 unhealthy d/yr today · 0 by 30 yrs out
Nearby sold comps map
Loading sold comps map…
Walkable amenities ~0.75 mi
Loading nearby amenities…
Taxation est. · year 1
- Rental income
- $90,708
- − Mortgage interest
- −$36,410
- − Property taxes
- −$10,326
- − Insurance
- −$3,250
- − Repairs & maintenance
- −$7,257
- − Management
- −$7,257
- − Depreciation
- −$18,909
- Taxable income
- $7,300
- Est. tax owed @ 24.0%
- −$1,752
- After-tax cash flow
- $15,427/yr
For passive investors: Depreciation is non-cash, so a rental often shows a tax loss while cash-flowing — sheltering income. Rental losses are passive: they offset passive income freely, and up to $25,000/yr can offset ordinary (W-2) income if you actively participate and your MAGI is under $100k (phasing out to $0 by $150k); unused losses carry forward. On sale, claimed depreciation is recaptured at up to 25%, and gains may owe capital-gains tax (a 1031 exchange can defer both). Figures are a year-1 estimate at your 24.0% rate — not tax advice; consult a CPA.
Schools (NCES district)
- District
- Claremont School District
- NCES district ID
- 3302340
- Math proficiency
- 24% ▼ -7.00%
- Reading proficiency
- 35% ▼ -5.00%
- Median HH income
- $43,285
- Composite
- 25.11/100
- National rank
- #7528
- State rank
- #85 of 98 in NH
Livability — Claremont
- Score
- 69/100
- State rank
- #50
- US rank
- #8815
Category grades
Schools grade is shown separately in the Schools card above.
Census & demographics
- Census place
- Claremont, NH
- County
- Sullivan County · 16,826 people
- City population
- 13,704
- Metro
- Lebanon, NH-VT
- Population (ZIP)
- 13,704
- Household income
- $59,625
- Rent vs Own
- Severe rent burden
- 642.0
Population outlook (Sullivan County) Hauer SSP2
- Today (2025)
- 41,322 people
- By 2030
- 39,910 · -3.4%
- By 2040
- 36,447 · -11.8%
- By 2050
- 32,917 · -20.3%
- By 2075
- 25,997 · -37.1%
- By 2100
- 19,479 · -52.9%
Race, ethnicity, and origin ACS 2023
- Neighborhood character
- Predominantly White (87%)
- Race & ethnicity
- White 87% Two or more races 6% Hispanic / Latino 5% Black 1%
- Hispanic origin (detail)
- Puerto Rican 4%
- Common ancestry
- Lithuanian 18% Slovak 4% Romanian 3%
- Foreign-born
- 2% · Canada
- Languages at home
- 97% English-only · Spanish 3%
Political lean MEDSL · Sullivan
- 2024 margin
- Toss-up / Even · D 49.1% · R 49.8% · Other 1.2%
- 2008→2024 swing
- -18.7pp toward R · 2008: 18.0pp · 2024: -0.7pp
- All cycles
- 2024: R+0.7 2020: D+3.6 2016: R+2.6 2012: D+13.3 2008: D+18.0
Not yet ingested
- Civics
- —
Market trends
- HPI YoY
- ▲ 0.20%
- Current HPI
- 337.0004
- Rent YoY
- —
- Metro
- Lebanon, NH-VT
- State GDP YoY
- —
- F500 in state
- 0
Price history
-30.1% since first listed10 events — show timeline
- 2026-06-17 Listed $650,000 PrimeMLS
- 2025-08-11 Sold (Public Records) $1,700,000 Public Records
- 2022-05-20 Sold (Public Records) $290,000 Public Records
- 2020-04-13 Sold (MLS) $175,000 PrimeMLS
- 2020-02-19 Pending — PrimeMLS
- 2020-02-13 Relisted — PrimeMLS
- 2020-01-29 Pending — PrimeMLS
- 2020-01-09 Listed $192,000 PrimeMLS
- 2018-12-18 Sold (Public Records) $1,300,000 Public Records
- 2018-12-17 Sold (Public Records) $930,000 Public Records
Property tax history
+3.0%/yrLatest (2025): $10,326 · +4.4% YoY. Source: county tax records.
Cash-flow waterfall
monthlySold comps — $/sqft
last 12 mo · ≤1 miLoading sold comps…