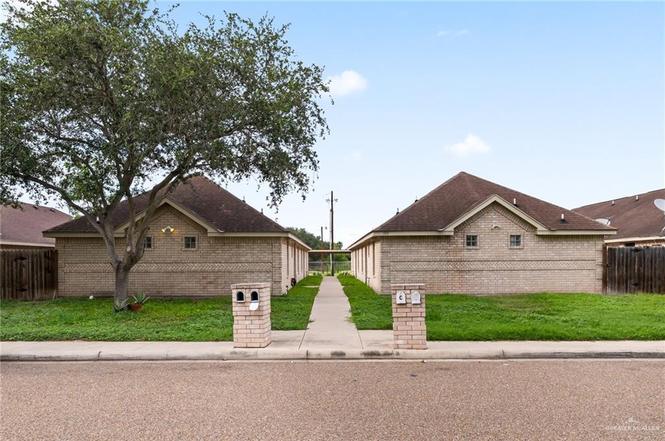
1513 Acme Ln
Edinburg, TX 78541
$380,000F
None bd · None ba ·
4,240 sqft ·
Built 2004
· Other
· Active
· 1 DOM
Cashflow @ list (25.0% down · 7.5%)
Estimated rent
$897/mo
Mortgage (P&I)
−$1,993
Tax + insurance
−$965
HOA
−$0
Vac / Maint / Mgmt
−$188
Net cashflow
$-2,249/mo
Annual
$-26,994/yr
Cap rate
-0.81%
Cash-on-cash
-25.37%
DSCR
-0.13
1% rule
0.24%
Cash to close
$106,400
Investor read
- This is a other listed at $380k.
- At list price, monthly cash flow is $-2k ($-27k/yr) — negative.
- To cash-flow at today's rent, offer at most $103k (73.0% below list).
- To meet the 1% rule (rent ≥ 1% of price), the offer needs to be $90k (76.4% below list).
- Only 1 days on market — expect competitive offers; lowballing is unlikely to land.
- Recommended offer: $90k (76.4% below list) — sets the bar for 1% rule.
- Local home prices are declining (-3.0%/yr); year-one equity from $3k of loan paydown is wiped out by about $11k of value loss. Plan a longer hold.
- Location reads 64/100 on livability (#784 in TX) — a middle-class / working-renter tenant base. Strengths: cost of living A+, housing A+; Watch: employment D, amenities F, commute F.
- Edinburg CISD (urban): math 20% / reading 34% proficiency, ranked #699 of 826 in TX (top 85%) — low school quality limits family demand, transient renter base, plan for 1-2y turnover; 62% free/reduced lunch — lower-income household profile, screen leases tightly.
- Zoned schools: Truman El (math 22% / reading 32%, grade F, #2,791 of 4,322 statewide, top 68%, 709 students, 86% FRL); B L Garza Middle (math 19% / reading 40%, grade F, #1,077 of 1,662 statewide, top 66%, 1,056 students, 82% FRL); Edinburg North H S (math 29% / reading 38%, grade F, #1,011 of 1,632 statewide, top 63%, 2,672 students, 83% FRL) — zoned schools average 83% FRL vs 62% district-wide (21 pts higher); higher-poverty schools than district average — tighter screening recommended.
- Watch-outs: property tax is 2.5% of price.
- Market conditions: Rents rising (+2.0%/yr); 515 active listings in the ZIP; 18 comparable units currently listed for rent nearby; rentals lingering (median 44d on market — plan ~5-8 weeks vacancy on turnover, expect pricing pressure); 61% of comp listings sitting > 30 days — soft ceiling on asking rent; 7,378 units permitted in Hidalgo County in 2024 (641 in 5+ unit buildings).
- Hidalgo County population projected at +28% by 2050 — long-run rental-demand tailwind backs the buy-and-hold thesis.
- 4 sale attempts since 6y ago with the ask held roughly flat each time — persistent listings suggest the price (not the market) is what's stuck; bring a comps-based counter.
- Climate carrying-cost: severe wind risk, 99% chance of damaging wind over 30y; major wildfire risk; extreme-heat days projected 7→23/yr by 2055 (HVAC capex compounding) — expect insurance premiums to compound above CPI over the hold.
- Cap rate -0.8% vs local median 2.4% in Edinburg — below-typical yield; the buyer is paying a premium for something (appreciation thesis, condition, location) that the cap rate doesn't capture.
Questions for listing agent
- What do current leases actually rent for vs. the listed asking? Can we see a recent rent roll and the last 12 months of T-12 income?
- Property tax is high relative to price — has the assessment been appealed recently, and will the sale trigger a re-assessment?
- Is there a deadline driving the sale (1031 exchange, divorce, estate, relocation)? That informs how much negotiation room exists.
- Schools are D-rated, which usually means shorter tenancies and higher turnover. Who's the typical renter profile here, and what's been the actual vacancy rate?
- The area grade is low — what's the realistic commute time and amenity access for the typical tenant pool here? Any planned neighborhood developments (good or bad) we should know about?
- What's the average days-on-market for RENTAL listings here right now (not sales)? A rising rental-DOM trend means longer vacancies and softer asking-rent achievability than the comps imply.
- What's the recent tenant-quality profile in this submarket — average credit score on applications, eviction rate, late-payment / NSF rate, and stable-employment percentage? A property-management company in the area should have these aggregated.
- How much new for-sale + rental construction is in the pipeline within 1–3 miles? Heavy new supply typically softens prices + rents 12–24 months out; constrained supply supports both.
CashFlowRE · CFR-X77X3Z1VN8TCVB
· Data 2 days ago
cashflowre.app · 2026-05-29