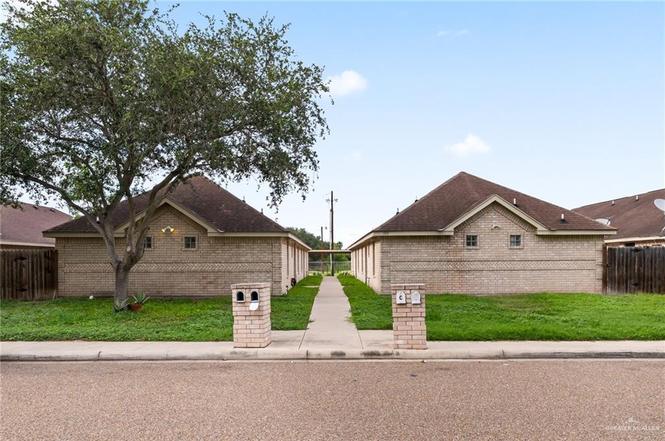
1513 Acme Ln · Edinburg, TX
Flood risk 1/10 · Minimal
- FEMA flood zone
- X (shaded)
- Chance of flooding over 30 yrs
- 0.0%
- Est. flood insurance / yr
- $507 – $1,088
Fire risk 7/10 · Major
- Est. fire insurance / yr
- $1,222 – $2,270
Heat risk 9/10 · Severe
- Hot days now (above 112°F)
- 7 days/yr
- Hot days in 30 yrs
- 23 days/yr
Wind risk 8/10 · Major
- Chance of severe wind over 30 yrs
- 99.0%
Air-quality risk 2/10 · Minimal
- Unhealthy air days now
- 0 days/yr
- Unhealthy air days in 30 yrs
- 1 days/yr
Risk factors via First Street. Map © Google.
Why this score? — see what drove the F grade
The composite is a weighted blend of 9 inputs, each scored 0–100. Each bar is that input's sub-score; the figure is the points it added to the 100-point composite (weight × sub-score).
- ARV discount +7.5/15.0
- Livability +3.2/5.0
- Rent growth +3.0/5.0
- Condition / age +2.5/5.0
- Schools +2.2/10.0
- Cash flow +0.0/30.0
- 1% rule +0.0/10.0
- DSCR +0.0/10.0
- Appreciation +0.0/10.0
$380,000
🖨 Deal sheet 📄 Offer letter ✓ Due diligence
Listing remarks MLS
Calling all investors!! Check out this amazing apartment fourplex available in Edinburg! The complex is well maintained, has covered parking and a great rental history. The property is located in a quiet neighborhood close to schools and minutes away from UTRGV. Come and take a tour of this property today!
Key facts
- Easy access
- Prime location
- Steady rental income
Tags
Property features AI
Finance
- Other: Lot approximately 0.29 acres (mature trees, paved road access)
- HOA & community: No HOA; Community includes sidewalks; Two units in the community
Exterior
- Parking: Covered carport for 8 vehicles; Total of 8 parking spaces; Garage faces rear (no enclosed garage spaces)
- Utilities: Public water; City sewer; Four separate water meters
- Home design: Brick construction
- Construction: Shingle roof; Slab foundation; Brick exterior
- Exterior features: Mature trees; Sidewalks; Partial wood fencing
Interior
- Kitchen: Smooth electric cooktop; Refrigerator; Electric water heater
- Flooring: Tile
- Heating & cooling: Central heating; Central air conditioning
- Interior features: Ceiling fans; Walk-in closet(s); Energy-efficient window screens (solar screens)
- Laundry & utility: Washer; Dryer; Laundry closet; Washer/Dryer connection
Neighborhood map
What this means for you Summary
Snapshot
- This is a other listed at $380k.
Deal economics
- At list price, monthly cash flow is $-2k ($-27k/yr) — negative.
- To cash-flow at today's rent, offer at most $103k (73.0% below list).
- To meet the 1% rule (rent ≥ 1% of price), the offer needs to be $90k (76.4% below list).
- Recommended offer: $90k (76.4% below list) — sets the bar for 1% rule.
- Cap rate -0.8% vs local median 2.4% in Edinburg — below-typical yield; the buyer is paying a premium for something (appreciation thesis, condition, location) that the cap rate doesn't capture.
Location & tenants
- Location reads 64/100 on livability (#784 in TX) — a middle-class / working-renter tenant base. Strengths: cost of living A+, housing A+; Watch: employment D, amenities F, commute F.
- Edinburg CISD (urban): math 20% / reading 34% proficiency, ranked #699 of 826 in TX (top 85%) — low school quality limits family demand, transient renter base, plan for 1-2y turnover; 62% free/reduced lunch — lower-income household profile, screen leases tightly.
- Zoned schools: Truman El (math 22% / reading 32%, grade F, #2,791 of 4,322 statewide, top 68%, 709 students, 86% FRL); B L Garza Middle (math 19% / reading 40%, grade F, #1,077 of 1,662 statewide, top 66%, 1,056 students, 82% FRL); Edinburg North H S (math 29% / reading 38%, grade F, #1,011 of 1,632 statewide, top 63%, 2,672 students, 83% FRL) — zoned schools average 83% FRL vs 62% district-wide (21 pts higher); higher-poverty schools than district average — tighter screening recommended.
- Market conditions: Rents rising (+2.0%/yr); 515 active listings in the ZIP; 18 comparable units currently listed for rent nearby; rentals lingering (median 44d on market — plan ~5-8 weeks vacancy on turnover, expect pricing pressure); 61% of comp listings sitting > 30 days — soft ceiling on asking rent; 7,378 units permitted in Hidalgo County in 2024 (641 in 5+ unit buildings).
Forward outlook
- Local home prices are declining (-3.0%/yr); year-one equity from $3k of loan paydown is wiped out by about $11k of value loss. Plan a longer hold.
- Hidalgo County population projected at +28% by 2050 — long-run rental-demand tailwind backs the buy-and-hold thesis.
Negotiation context
- Only 1 days on market — expect competitive offers; lowballing is unlikely to land.
- 4 sale attempts since 6y ago with the ask held roughly flat each time — persistent listings suggest the price (not the market) is what's stuck; bring a comps-based counter.
Risks & watch-outs
- Watch-outs: property tax is 2.5% of price.
- Climate carrying-cost: severe wind risk, 99% chance of damaging wind over 30y; major wildfire risk; extreme-heat days projected 7→23/yr by 2055 (HVAC capex compounding) — expect insurance premiums to compound above CPI over the hold.
Questions for the listing agent
- What do current leases actually rent for vs. the listed asking? Can we see a recent rent roll and the last 12 months of T-12 income?
- Property tax is high relative to price — has the assessment been appealed recently, and will the sale trigger a re-assessment?
- Is there a deadline driving the sale (1031 exchange, divorce, estate, relocation)? That informs how much negotiation room exists.
- Schools are D-rated, which usually means shorter tenancies and higher turnover. Who's the typical renter profile here, and what's been the actual vacancy rate?
- The area grade is low — what's the realistic commute time and amenity access for the typical tenant pool here? Any planned neighborhood developments (good or bad) we should know about?
- What's the average days-on-market for RENTAL listings here right now (not sales)? A rising rental-DOM trend means longer vacancies and softer asking-rent achievability than the comps imply.
- What's the recent tenant-quality profile in this submarket — average credit score on applications, eviction rate, late-payment / NSF rate, and stable-employment percentage? A property-management company in the area should have these aggregated.
- How much new for-sale + rental construction is in the pipeline within 1–3 miles? Heavy new supply typically softens prices + rents 12–24 months out; constrained supply supports both.
Investment metrics
- 1% rule
- 0.24% ✗
- Cap rate
- -0.81%
- Cash-on-cash
- -25.37%
- DSCR
- -0.13
- GRM
- 35.3
CMA / ARV
No comps found within radius.
Projected returns pro-forma
-3.0% appreciation · 2.01% rent growth · sell at horizon
- IRR
- -74.2%
- Equity multiple
- -0.93×
- Total profit
- $-205,514
- Equity at exit
- $56,659
- IRR
- —
- Equity multiple
- -2.44×
- Total profit
- $-366,117
- Equity at exit
- $32,855
Cash invested: $106,400 (down + closing). Projections, not guarantees.
Landlord ↔ Tenant lean methodology
- Overall (STATE)
- 87 Strongly Landlord-Friendly
- State Texas
- 87 Strongly Landlord-Friendly · R+5
- County
- — inherits STATE
- City
- — inherits STATE
ZIP-level market 78541
- Home prices YoY
- -7.6%
- Rents YoY
- 2.0%
- Active inventory
- 515
- Price-to-rent
- 35.3×
Monthly cashflow live
- Estimated rent
- $897 high interval (Pro) →
- Mortgage (P&I)
- −$1,993
- Tax from tax record
- −$807 /mo · $9,681/yr
- Insurance
- −$158
- HOA
- −$0
- Vacancy / Maint / Mgmt
- −$188
- Net cashflow
- $-2,249
Break-even live
UW: 25.0% down · 7.5% · 30yr · 1.5% tax · 5.0% vac · 8.0% maint · 8.0% mgmt
Financing live
Cash to close
- Down payment
- $95,000
- Closing costs
- $11,400
- Reserves months
- —
- Total cash needed
- —
Loan-product check · same deal, 3 products live
Conventional
25% down · 7.5% · 30yr
- Down + closing
- —
- Monthly P&I
- —
- Monthly cashflow
- —
- DSCR
- —
- Eligible?
- —
Personal DTI + credit; lowest rate.
DSCR
20% down · 8.5% · 30yr
- Down + closing
- —
- Monthly P&I
- —
- Monthly cashflow
- —
- DSCR
- —
- Eligible?
- —
No personal income docs; deal must DSCR.
Hard money
10% down · 12.0% · 12mo
- Down + closing
- —
- Monthly P&I
- —
- Monthly cashflow
- —
- DSCR
- —
- Eligible?
- —
Short-term bridge; refi at stabilization.
Rent comps 18 comps
| Address | Beds | Baths | Sqft | Rent | $/sqft | DOM | Units | Dist |
|---|---|---|---|---|---|---|---|---|
| 1513 Acme Ln Unit D Edinburg, TX | 2.0 | 2.0 | 4240 | $875 | $0.21 | 23d | 1 | 0.03mi |
| 2218 N Hester St Unit 2 Edinburg, TX | 3.0 | 2.0 | 3247 | $1,400 | $0.43 | 43d | 1 | 0.07mi |
| 1509 Prosperity Dr Unit 4 Edinburg, TX | 2.0 | 2.0 | 3808 | $825 | $0.22 | 43d | 1 | 0.59mi |
| 1409 W Prosperity Dr Unit 2, 3, 4 Edinburg, TX | 2.0 | 2.0 | 3808 | $750 | $0.20 | 14d | 1 | 0.60mi |
| 1408 W Prosperity Dr Unit D Edinburg, TX | 2.0 | 2.0 | 3808 | $800 | $0.21 | 23d | 1 | 0.62mi |
| 2010 Bahamas Dr Unit 3 Edinburg, TX | 3.0 | 1.0 | 3596 | $850 | $0.24 | 23d | 1 | 0.70mi |
| 2101 Bahamas Dr Edinburg, TX | 1.0 | 1.0 | 3472 | $725 | $0.21 | 43d | 1 | 0.71mi |
| 3408 Golden Nugget Unit 1 Edinburg, TX | 2.0 | 2.0 | 4234 | $1,050 | $0.25 | 43d | 1 | 0.80mi |
| 2013 Stardust Ln Unit 1 Edinburg, TX | 2.0 | 2.0 | 3892 | $1,100 | $0.28 | 43d | 1 | 0.86mi |
| 1803 Agua Fina Ave Unit 1 Edinburg, TX | 2.0 | 2.0 | 3920 | $800 | $0.20 | 43d | 1 | 0.89mi |
| 1908 Agua Fina Ave Unit 1 Edinburg, TX | 2.0 | 2.0 | 3834 | $780 | $0.20 | 19d | 1 | 0.96mi |
| 2407 Moonlight Ln Unit 3 Edinburg, TX | 2.0 | 2.0 | 3920 | $800 | $0.20 | 43d | 1 | 0.99mi |
| 1711 Tampa St Unit A Edinburg, TX | 2.0 | 2.0 | 4234 | $825 | $0.19 | 43d | 1 | 1.03mi |
| 928 French Ave Unit 3 Edinburg, TX | 2.0 | 2.0 | 3876 | $800 | $0.21 | 43d | 1 | 1.06mi |
| 207 Fig Dr Unit 2 Edinburg, TX | 2.0 | 2.0 | 4160 | $950 | $0.23 | 14d | 1 | 1.14mi |
| 205 Teak Dr Unit 4 Edinburg, TX | 2.0 | 3.0 | 4406 | $1,150 | $0.26 | 43d | 1 | 1.20mi |
| 420 W Chavez St Unit 1 Edinburg, TX | 2.0 | 2.0 | 4408 | $1,200 | $0.27 | 43d | 1 | 1.26mi |
| 619 La Mancha Dr Unit 1 Edinburg, TX | 2.0 | 2.0 | 3944 | $850 | $0.22 | 14d | 1 | 1.49mi |
Listing history 2 events
-
2026-06-18remarks 440-char remark
-
2026-06-18$380,000 Active 1 DOM
ⓘ Source: listings_history table (triggers on properties + properties_extension) + one-shot
backfill from property_details.listing_events for pre-trigger history.
Tax reassessment forecast TX · Resets to sale price
- Current annual tax
- $9,681 · $807/mo
- Projected year-2 tax
- $9,681 · $807/mo
- Expected delta
- $0/yr ($0/mo · 0.0%)
ⓘ Screening estimate from a state-policy table — verify with the county assessor before closing.
Climate risk First Street
- Flood 1/10 Low FEMA zone X (shaded) · 0% chance over 30 yrs
- Wildfire 7/10 Severe
- Heat 9/10 Extreme 7 d/yr ≥112°F today · 23 d/yr by 30 yrs out
- Wind 8/10 Severe 99% chance of damaging wind over 30 yrs
- Air quality 2/10 Low 0 unhealthy d/yr today · 1 by 30 yrs out
Nearby sold comps map
Loading sold comps map…
Walkable amenities ~0.75 mi
Loading nearby amenities…
Taxation est. · year 1
- Rental income
- $10,760
- − Mortgage interest
- −$21,286
- − Property taxes
- −$9,681
- − Insurance
- −$1,900
- − Repairs & maintenance
- −$861
- − Management
- −$861
- − Depreciation
- −$11,055
- Taxable loss
- −$34,883
- Est. tax savings @ 24.0%
- +$8,372
- After-tax cash flow
- $-18,622/yr
For passive investors: Depreciation is non-cash, so a rental often shows a tax loss while cash-flowing — sheltering income. Rental losses are passive: they offset passive income freely, and up to $25,000/yr can offset ordinary (W-2) income if you actively participate and your MAGI is under $100k (phasing out to $0 by $150k); unused losses carry forward. On sale, claimed depreciation is recaptured at up to 25%, and gains may owe capital-gains tax (a 1031 exchange can defer both). Figures are a year-1 estimate at your 24.0% rate — not tax advice; consult a CPA.
Schools (NCES district)
- District
- Edinburg CISD
- NCES district ID
- 4818180
- Math proficiency
- 20% ▼ -34.00%
- Reading proficiency
- 34% ▼ -11.00%
- Median HH income
- $36,985
- Composite
- 22.42/100
- National rank
- #8114
- State rank
- #699 of 826 in TX
Livability — Edinburg
- Score
- 64/100
- State rank
- #784
- US rank
- #14319
Category grades
Schools grade is shown separately in the Schools card above.
Census & demographics
- Census place
- Edinburg, TX
- County
- Hidalgo County · 623,128 people
- City population
- 178,279
- Metro
- McAllen-Edinburg-Mission, TX
- Population (ZIP)
- 51,710
- Household income
- $52,863
- Rent vs Own
- Severe rent burden
- 1963.0
Population outlook (Hidalgo County) Hauer SSP2
- Today (2025)
- 955,232 people
- By 2030
- 1,009,774 · +5.7%
- By 2040
- 1,120,332 · +17.3%
- By 2050
- 1,225,036 · +28.2%
- By 2075
- 1,439,189 · +50.7%
- By 2100
- 1,533,429 · +60.5%
Race, ethnicity, and origin ACS 2023
- Neighborhood character
- Predominantly Hispanic (88%)
- Race & ethnicity
- Hispanic / Latino 88% Two or more races 49% White 8% Black 2% Asian 2%
- Hispanic origin (detail)
- Mexican 83%
- Foreign-born
- 22% · Canada, South Korea, Jamaica
- Languages at home
- 24% English-only · Spanish 73% Other Indo-European 1% Korean 1%
Political lean MEDSL · Hidalgo
- 2024 margin
- Toss-up / Even · D 48.1% · R 51.0%
- 2008→2024 swing
- -41.6pp toward R · 2008: 38.7pp · 2024: -2.9pp
- All cycles
- 2024: R+2.9 2020: D+17.1 2016: D+40.5 2012: D+41.8 2008: D+38.7
Not yet ingested
- Civics
- —
Market trends
- HPI YoY
- ▼ -17.63%
- Current HPI
- 215.1057
- Rent YoY
- ▲ 2.01%
- Metro
- McAllen-Edinburg-Mission, TX
- State GDP YoY
- ▲ 3.95%
- F500 in state
- 110
Industry mix (Fortune 500 HQ in TX)
| Industry | F500 HQs | Revenue |
|---|---|---|
| Energy | 16 | $1,198B |
|
||
| Technology | 5 | $198B |
|
||
| Engineering / Construction | 4 | $72B |
|
||
| Energy Services | 3 | $60B |
|
||
| Utilities | 3 | $41B |
|
||
| Healthcare | 2 | $330B |
|
||
Price history
+40.8% since first listed11 events — show timeline
- 2026-06-18 Listed $380,000 MCALLENMLS
- 2026-05-21 Rental Removed $875 TENANTTURNER2
- 2026-03-31 Listed for Rent $875 TENANTTURNER2
- 2021-03-22 Sold (Public Records) — Public Records
- 2021-03-19 Sold (MLS) — MCALLENMLS
- 2021-01-24 Pending — MCALLENMLS
- 2021-01-13 Contingent — MCALLENMLS
- 2021-01-06 Relisted — MCALLENMLS
- 2021-01-01 Contingent — MCALLENMLS
- 2020-12-21 Listed $269,900 MCALLENMLS
- 2003-02-20 Sold (Public Records) — Public Records
Property tax history
+6.1%/yrLatest (2025): $9,681 · +15.6% YoY. Source: county tax records.
Cash-flow waterfall
monthlySold comps — $/sqft
last 12 mo · ≤1 miLoading sold comps…