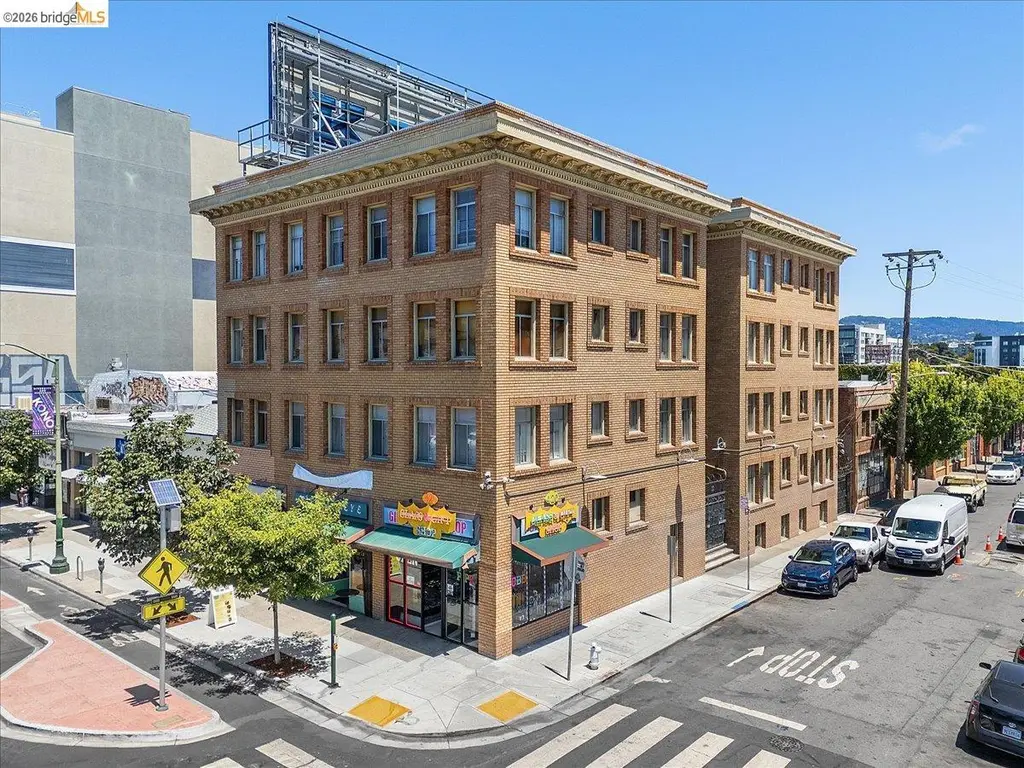
498 25th St
Oakland, CA 94612
$4,695,000F
24 bd · 28.0 ba ·
1,600 sqft ·
Built 1913
· Townhouse
· Pending
· 59 DOM
Cashflow @ list (25.0% down · 7.5%)
Estimated rent
$4,393/mo
Mortgage (P&I)
−$24,621
Tax + insurance
−$4,468
HOA
−$0
Vac / Maint / Mgmt
−$922
Net cashflow
$-25,619/mo
Annual
$-307,425/yr
Cap rate
-0.26%
Cash-on-cash
-23.39%
DSCR
-0.04
1% rule
0.09%
Cash to close
$1,314,600
Investor read
- This is a 24-bed/28.0-bath townhouse listed at $4.70M.
- At list price, monthly cash flow is $-26k ($-307k/yr) — negative.
- To cash-flow at today's rent, offer at most $502k (89.3% below list).
- To meet the 1% rule (rent ≥ 1% of price), the offer needs to be $439k (90.6% below list).
- It's been on market 59 days — a 3% lower offer ($4.55M) is reasonable based on typical stale-listing flexibility.
- Recommended offer: $439k (90.6% below list) — sets the bar for 1% rule.
- Local home prices are declining (-3.0%/yr); year-one equity from $32k of loan paydown is wiped out by about $141k of value loss. Plan a longer hold.
- Location reads 71/100 on livability (#224 in CA) — a middle-class / working-renter tenant base. Strengths: amenities A+, commute A+, employment A+; Watch: schools C-, crime F, cost of living F.
- Oakland Unified (urban): math 27% / reading 33% proficiency, ranked #1,007 of 1,400 in CA (top 72%) — families likely to look elsewhere, expect single-tenant / working-renter base with shorter leases; 68% free/reduced lunch — lower-income household profile, screen leases tightly.
- Watch-outs: built in 1913 — expect roof / HVAC / electrical / plumbing capex.
- Market conditions: Rents rising fast (+7.2%/yr); 37 active listings in the ZIP; 1,742 units permitted in Alameda County in 2024 (856 in 5+ unit buildings).
- Alameda County population projected at +34% by 2050 — long-run rental-demand tailwind backs the buy-and-hold thesis.
- 20 sale attempts since 3y ago; this cycle's ask is 313109% above the opening price — seller raised mid-cycle; expect resistance to lowballs.
- Current owner paid $185k; list at $4.70M implies a 2438% gain — meaningful room to come down on a strong offer.
- Cap rate -0.3% vs local median 2.4% in Oakland — below-typical yield; the buyer is paying a premium for something (appreciation thesis, condition, location) that the cap rate doesn't capture.
- At $4,393/mo this rent would consume 71% of the median local household income ($74k/yr) (locally 2526% of renters already pay >50% of income on rent) — very limited rent-growth headroom before tenants either downsize or default.
Questions for listing agent
- What do current leases actually rent for vs. the listed asking? Can we see a recent rent roll and the last 12 months of T-12 income?
- It's been on market 59 days. Have you received any prior offers? Is the seller open to a 91% concession, seller financing, or rate buy-down credit?
- Built in 1913 — when were the roof, HVAC, electrical panel, plumbing, and water heater last replaced?
- Is there a deadline driving the sale (1031 exchange, divorce, estate, relocation)? That informs how much negotiation room exists.
- Crime grade is F in this area — have there been break-ins, vandalism, or insurance claims at this property in the last 3 years? What carrier currently insures it and at what premium?
- The area grade is low — what's the realistic commute time and amenity access for the typical tenant pool here? Any planned neighborhood developments (good or bad) we should know about?
- What's the average days-on-market for RENTAL listings here right now (not sales)? A rising rental-DOM trend means longer vacancies and softer asking-rent achievability than the comps imply.
- What's the recent tenant-quality profile in this submarket — average credit score on applications, eviction rate, late-payment / NSF rate, and stable-employment percentage? A property-management company in the area should have these aggregated.
CashFlowRE · CFR-X98DZ868G5NFFC
· Data 1 week ago
cashflowre.app · 2026-05-29