498 25th St · Oakland, CA
Flood risk No data
- FEMA flood zone
- —
- Chance of flooding over 30 yrs
- —
- Est. flood insurance / yr
- —
Fire risk No data
- Est. fire insurance / yr
- —
Heat risk No data
- Hot days now (above threshold)
- —
- Hot days in 30 yrs
- —
Wind risk No data
- Chance of severe wind over 30 yrs
- —
Air-quality risk No data
- Unhealthy air days now
- —
- Unhealthy air days in 30 yrs
- —
Risk factors via First Street. Map © Google.
Why this score? — see what drove the F grade
The composite is a weighted blend of 9 inputs, each scored 0–100. Each bar is that input's sub-score; the figure is the points it added to the 100-point composite (weight × sub-score).
- Rent growth +4.3/5.0
- Livability +3.6/5.0
- Schools +3.0/10.0
- Condition / age +2.5/5.0
- Appreciation +2.3/10.0
- ARV discount +1.2/15.0
- Cash flow +0.0/30.0
- 1% rule +0.0/10.0
- DSCR +0.0/10.0
$4,695,000
🖨 Deal sheet 📄 Offer letter ✓ Due diligence
Listing remarks MLS
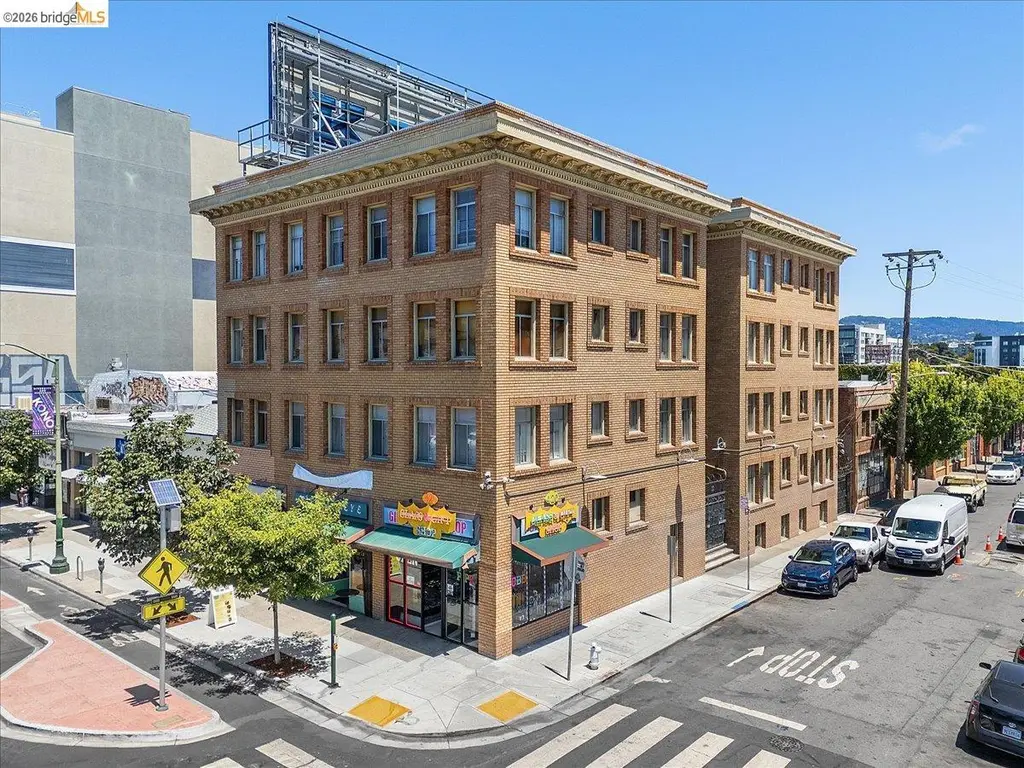
Rare opportunity to own a well maintained 28-unit mixed-use property in Oakland’s thriving Uptown neighborhood. Located at 498 25th Street, this freestanding 4-story building was originally built in 1913 and effortlessly blends timeless architectural charm with modern upgrades, offering both strong income potential and an exceptional living experience. Tenants also, enjoy the ease of on-site laundry facilities and a secured private entrance, enhancing comfort and peace of mind. The property includes 25 residential units, 3 retail suites and additional income from a rooftop billboard. This diligently maintained property presents a rare chance to acquire a high-performing asset in one of Oakland’s most iconic neighborhoods. With a diverse unit mix, modern amenities, and strong income potential, this is an investment opportunity not to be missed. Don’t miss your chance to own a piece of Oakland’s history while securing a high-performing income property.
Key facts
- Diverse unit mix
- Modern amenities
- Rooftop billboard
Tags
Neighborhood map
What this means for you Summary
Snapshot
- This is a 24-bed/28.0-bath townhouse listed at $4.70M.
Deal economics
- At list price, monthly cash flow is $-26k ($-308k/yr) — negative.
- To cash-flow at today's rent, offer at most $501k (89.3% below list).
- To meet the 1% rule (rent ≥ 1% of price), the offer needs to be $438k (90.7% below list).
- Recommended offer: $438k (90.7% below list) — sets the bar for 1% rule.
- Cap rate -0.3% vs local median 2.4% in Oakland — below-typical yield; the buyer is paying a premium for something (appreciation thesis, condition, location) that the cap rate doesn't capture.
Location & tenants
- Location reads 71/100 on livability (#224 in CA) — a middle-class / working-renter tenant base. Strengths: amenities A+, commute A+, employment A+; Watch: schools C-, crime F, cost of living F.
- Oakland Unified (urban): math 27% / reading 33% proficiency, ranked #1,007 of 1,400 in CA (top 72%) — families likely to look elsewhere, expect single-tenant / working-renter base with shorter leases; 68% free/reduced lunch — lower-income household profile, screen leases tightly.
- Market conditions: Rents rising fast (+7.2%/yr); 37 active listings in the ZIP; 1,742 units permitted in Alameda County in 2024 (856 in 5+ unit buildings).
- At $4,383/mo this rent would consume 71% of the median local household income ($74k/yr) (locally 2526% of renters already pay >50% of income on rent) — very limited rent-growth headroom before tenants either downsize or default.
Forward outlook
- Local home prices are declining (-3.0%/yr); year-one equity from $32k of loan paydown is wiped out by about $141k of value loss. Plan a longer hold.
- Alameda County population projected at +34% by 2050 — long-run rental-demand tailwind backs the buy-and-hold thesis.
Negotiation context
- It's been on market 59 days — a 3% lower offer ($4.55M) is reasonable based on typical stale-listing flexibility.
- 20 sale attempts since 3y ago; this cycle's ask is 313109% above the opening price — seller raised mid-cycle; expect resistance to lowballs.
- Current owner paid $185k; list at $4.70M implies a 2438% gain — meaningful room to come down on a strong offer.
Risks & watch-outs
- Watch-outs: built in 1913 — expect roof / HVAC / electrical / plumbing capex.
Questions for the listing agent
- What do current leases actually rent for vs. the listed asking? Can we see a recent rent roll and the last 12 months of T-12 income?
- It's been on market 59 days. Have you received any prior offers? Is the seller open to a 91% concession, seller financing, or rate buy-down credit?
- Built in 1913 — when were the roof, HVAC, electrical panel, plumbing, and water heater last replaced?
- Is there a deadline driving the sale (1031 exchange, divorce, estate, relocation)? That informs how much negotiation room exists.
- Crime grade is F in this area — have there been break-ins, vandalism, or insurance claims at this property in the last 3 years? What carrier currently insures it and at what premium?
- The area grade is low — what's the realistic commute time and amenity access for the typical tenant pool here? Any planned neighborhood developments (good or bad) we should know about?
- What's the average days-on-market for RENTAL listings here right now (not sales)? A rising rental-DOM trend means longer vacancies and softer asking-rent achievability than the comps imply.
- What's the recent tenant-quality profile in this submarket — average credit score on applications, eviction rate, late-payment / NSF rate, and stable-employment percentage? A property-management company in the area should have these aggregated.
- How much new for-sale + rental construction is in the pipeline within 1–3 miles? Heavy new supply typically softens prices + rents 12–24 months out; constrained supply supports both.
Investment metrics
- 1% rule
- 0.09% ✗
- Cap rate
- -0.26%
- Cash-on-cash
- -23.39%
- DSCR
- -0.04
- GRM
- 89.3
CMA / ARV
- ARV (median comp)
- $4,120,446
- List price
- $4,695,000
- Delta
- 13.94%
- Verdict
- OVERPRICED
- Comps
- 1 within 2.0 mi
Projected returns pro-forma
-3.0% appreciation · 7.23% rent growth · sell at horizon
- IRR
- -66.2%
- Equity multiple
- -0.81×
- Total profit
- $-2,375,507
- Equity at exit
- $700,040
- IRR
- —
- Equity multiple
- -2.11×
- Total profit
- $-4,091,244
- Equity at exit
- $405,938
Cash invested: $1,314,600 (down + closing). Projections, not guarantees.
Landlord ↔ Tenant lean methodology
- Overall (CITY)
- 0 Strongly Tenant-Friendly
- State California
- 18 Strongly Tenant-Friendly · D+13
- County
- — inherits STATE
- City Oakland
- 0 Strongly Tenant-Friendly · D+62
ZIP-level market 94612
- Home prices YoY
- -2.5%
- Rents YoY
- 7.2%
- Active inventory
- 37
- Price-to-rent
- 89.3×
Monthly cashflow live
- Estimated rent
- $4,383 medium interval (Pro) →
- Mortgage (P&I)
- −$24,621
- Tax from tax record
- −$2,512 /mo · $30,141/yr
- Insurance
- −$1,956
- HOA
- −$0
- Vacancy / Maint / Mgmt
- −$920
- Net cashflow
- $-25,627
Break-even live
UW: 25.0% down · 7.5% · 30yr · 1.5% tax · 5.0% vac · 8.0% maint · 8.0% mgmt
Financing live
Cash to close
- Down payment
- $1,173,750
- Closing costs
- $140,850
- Reserves months
- —
- Total cash needed
- —
Loan-product check · same deal, 3 products live
Conventional
25% down · 7.5% · 30yr
- Down + closing
- —
- Monthly P&I
- —
- Monthly cashflow
- —
- DSCR
- —
- Eligible?
- —
Personal DTI + credit; lowest rate.
DSCR
20% down · 8.5% · 30yr
- Down + closing
- —
- Monthly P&I
- —
- Monthly cashflow
- —
- DSCR
- —
- Eligible?
- —
No personal income docs; deal must DSCR.
Hard money
10% down · 12.0% · 12mo
- Down + closing
- —
- Monthly P&I
- —
- Monthly cashflow
- —
- DSCR
- —
- Eligible?
- —
Short-term bridge; refi at stabilization.
Listing history 43 events
-
2026-05-14historical $1,499
-
2026-05-08$1,499
-
2026-04-30historical $1,499
-
2026-03-23$4,695,000 Active 990-char remark
Show marketing remark (990 chars)
Rare opportunity to own a well maintained 28-unit mixed-use property in Oakland’s thriving Uptown neighborhood. Located at 498 25th Street, this freestanding 4-story building was originally built in 1913 and effortlessly blends timeless architectural charm with modern upgrades, offering both strong income potential and an exceptional living experience. Tenants also, enjoy the ease of on-site laundry facilities and a secured private entrance, enhancing comfort and peace of mind. The property includes 25 residential units, 3 retail suites and additional income from a rooftop billboard. This diligently maintained property presents a rare chance to acquire a high-performing asset in one of Oakland’s most iconic neighborhoods. With a diverse unit mix, modern amenities, and strong income potential, this is an investment opportunity not to be missed. Don’t miss your chance to own a piece of Oakland’s history while securing a high-performing income property.
-
2026-03-15historical $1,499
-
2026-03-14historical $1,499
-
2026-02-22historical
-
2026-02-13$1,499
-
2026-02-11historical $1,499
-
2026-01-25$1,499
-
2026-01-25$1,549
-
2026-01-17Active
-
2026-01-06historical $1,549
-
2026-01-05$1,549
-
2025-12-31price $1,999
-
2025-11-06historical $1,500
-
2025-11-05$1,500
-
2025-11-05$1,949
-
2025-11-05historical $1,949
-
2025-10-06$1,949
-
2025-10-05historical $1,949
-
2025-09-17$1,949
-
2025-09-17historical $1,949
-
2025-06-14$1,949
-
2025-05-31historical $1,949
-
2025-05-31historical $1,949
-
2025-05-31$1,949
-
2025-05-31$1,449
-
2025-03-28historical $1,499
-
2025-02-01$1,499
-
2025-01-09historical $1,499
-
2025-01-04$1,499
-
2024-12-21historical $2,149
-
2024-11-02$2,149
-
2024-09-27historical $1,599
-
2024-09-05$1,599
-
2023-10-15historical $1,399
-
2023-10-14$1,399
-
2023-10-08historical $1,450
-
2023-10-04$1,450
-
2000-06-29soldstatus $185,000
-
1996-08-13soldstatus $350,000
-
1988-03-28soldstatus $650,000
ⓘ Source: listings_history table (triggers on properties + properties_extension) + one-shot
backfill from property_details.listing_events for pre-trigger history.
Tax reassessment forecast CA · Resets to sale price
- Current annual tax
- $30,141 · $2,512/mo
- Projected year-2 tax
- $35,682 · $2,974/mo
- Expected delta
- +$5,541/yr (+$462/mo · 18.4%)
ⓘ Screening estimate from a state-policy table — verify with the county assessor before closing.
Nearby sold comps map
Loading sold comps map…
Walkable amenities ~0.75 mi
Loading nearby amenities…
Taxation est. · year 1
- Rental income
- $52,597
- − Mortgage interest
- −$262,993
- − Property taxes
- −$30,141
- − Insurance
- −$23,475
- − Repairs & maintenance
- −$4,208
- − Management
- −$4,208
- − Depreciation
- −$136,582
- Taxable loss
- −$409,010
- Est. tax savings @ 24.0%
- +$98,162
- After-tax cash flow
- $-209,356/yr
For passive investors: Depreciation is non-cash, so a rental often shows a tax loss while cash-flowing — sheltering income. Rental losses are passive: they offset passive income freely, and up to $25,000/yr can offset ordinary (W-2) income if you actively participate and your MAGI is under $100k (phasing out to $0 by $150k); unused losses carry forward. On sale, claimed depreciation is recaptured at up to 25%, and gains may owe capital-gains tax (a 1031 exchange can defer both). Figures are a year-1 estimate at your 24.0% rate — not tax advice; consult a CPA.
Schools (NCES district)
- District
- Oakland Unified
- NCES district ID
- 0628050
- Math proficiency
- 27% ▬ 0.00%
- Reading proficiency
- 33% ▬ 0.00%
- Median HH income
- $55,194
- Composite
- 29.52/100
- National rank
- #11769
- State rank
- #1007 of 1400 in CA
Livability — Oakland
- Score
- 71/100
- State rank
- #224
- US rank
- #7245
Category grades
Schools grade is shown separately in the Schools card above.
Census & demographics
- Census place
- Oakland, CA
- County
- Alameda County · 1,614,355 people
- City population
- 385,993
- Metro
- San Francisco-Oakland-Berkeley, CA
- Population (ZIP)
- 18,175
- Household income
- $74,037
- Rent vs Own
- Severe rent burden
- 2526.0
Population outlook (Alameda County) Hauer SSP2
- Today (2025)
- 1,928,884 people
- By 2030
- 2,069,146 · +7.3%
- By 2040
- 2,338,405 · +21.2%
- By 2050
- 2,586,608 · +34.1%
- By 2075
- 3,061,911 · +58.7%
- By 2100
- 3,234,133 · +67.7%
Race, ethnicity, and origin ACS 2023
- Neighborhood character
- Highly diverse neighborhood (Simpson 0.76)
- Race & ethnicity
- White 30% Asian 27% Black 26% Hispanic / Latino 10% Two or more races 8%
- Hispanic origin (detail)
- Mexican 7%
- Common ancestry
- Romanian 2% Slovak 2% Italian 2%
- Foreign-born
- 32% · China, Canada, South Korea
- Languages at home
- 65% English-only · Chinese 14% Spanish 5% Other Indo-European 3%
Political lean MEDSL · Alameda
- 2024 margin
- Solid D (+53.6) · D 74.6% · R 21.0% · Other 4.4%
- 2008→2024 swing
- -5.9pp toward R · 2008: 59.5pp · 2024: 53.6pp
- All cycles
- 2024: D+53.6 2020: D+62.5 2016: D+64.4 2012: D+59.8 2008: D+59.5
Not yet ingested
- Civics
- —
Market trends
- HPI YoY
- ▼ -5.34%
- Current HPI
- 212.2879
- Rent YoY
- ▲ 7.23%
- Metro
- San Francisco-Oakland-Berkeley, CA
- State GDP YoY
- ▲ 3.21%
- F500 in state
- 116
Industry mix (Fortune 500 HQ in CA)
| Industry | F500 HQs | Revenue |
|---|---|---|
| Technology | 27 | $1,492B |
|
||
| Financial Services | 3 | $174B |
|
||
| Retail | 3 | $44B |
|
||
| Insurance | 3 | $26B |
|
||
| Media / Entertainment | 2 | $115B |
|
||
| Pharmaceuticals / Biotech | 2 | $62B |
|
||
Price history
-99.8% since first listed43 events — show timeline
- 2026-05-14 Rental Removed $1,499 RENTALBEAST
- 2026-05-08 Listed for Rent $1,499 RENTALBEAST
- 2026-04-30 Rental Removed $1,499 RENTALBEAST
- 2026-03-23 Listed $4,695,000 bridgeMLS, Bay East AOR, or Contra Costa AOR
- 2026-03-15 Rental Removed $1,499 RENTALBEAST
- 2026-03-14 Rental Removed $1,499 RENTALBEAST
- 2026-02-22 Listing Removed — bridgeMLS, Bay East AOR, or Contra Costa AOR
- 2026-02-13 Listed for Rent $1,499 RENTALBEAST
- 2026-02-11 Rental Removed $1,499 RENTALBEAST
- 2026-01-25 Listed for Rent $1,499 RENTALBEAST
- 2026-01-25 Listed for Rent $1,549 RENTALBEAST
- 2026-01-17 Listed — bridgeMLS, Bay East AOR, or Contra Costa AOR
- 2026-01-06 Rental Removed $1,549 RENTALBEAST
- 2026-01-05 Listed for Rent $1,549 RENTALBEAST
- 2025-12-31 Price Changed $1,999 RENTALBEAST
- 2025-11-06 Rental Removed $1,500 RENTALBEAST
- 2025-11-05 Listed for Rent $1,500 RENTALBEAST
- 2025-11-05 Listed for Rent $1,949 RENTALBEAST
- 2025-11-05 Rental Removed $1,949 RENTALBEAST
- 2025-10-06 Listed for Rent $1,949 RENTALBEAST
- 2025-10-05 Rental Removed $1,949 RENTALBEAST
- 2025-09-17 Listed for Rent $1,949 RENTALBEAST
- 2025-09-17 Rental Removed $1,949 RENTALBEAST
- 2025-06-14 Listed for Rent $1,949 RENTALBEAST
- 2025-05-31 Rental Removed $1,949 RENTALBEAST
- 2025-05-31 Rental Removed $1,949 RENTALBEAST
- 2025-05-31 Listed for Rent $1,949 RENTALBEAST
- 2025-05-31 Listed for Rent $1,449 RENTALBEAST
- 2025-03-28 Rental Removed $1,499 RENTALBEAST
- 2025-02-01 Listed for Rent $1,499 RENTALBEAST
- 2025-01-09 Rental Removed $1,499 RENTALBEAST
- 2025-01-04 Listed for Rent $1,499 RENTALBEAST
- 2024-12-21 Rental Removed $2,149 RENTALBEAST
- 2024-11-02 Listed for Rent $2,149 RENTALBEAST
- 2024-09-27 Rental Removed $1,599 RENTALBEAST
- 2024-09-05 Listed for Rent $1,599 RENTALBEAST
- 2023-10-15 Rental Removed $1,399 APPFOLIO
- 2023-10-14 Listed for Rent $1,399 APPFOLIO
- 2023-10-08 Rental Removed $1,450 APPFOLIO
- 2023-10-04 Listed for Rent $1,450 APPFOLIO
- 2000-06-29 Sold (Public Records) $185,000 Public Records
- 1996-08-13 Sold (Public Records) $350,000 Public Records
- 1988-03-28 Sold (Public Records) $650,000 Public Records
Property tax history
+5.1%/yrLatest (2025): $30,141 · +6.5% YoY. Source: county tax records.
Cash-flow waterfall
monthlySold comps — $/sqft
last 12 mo · ≤1 miLoading sold comps…