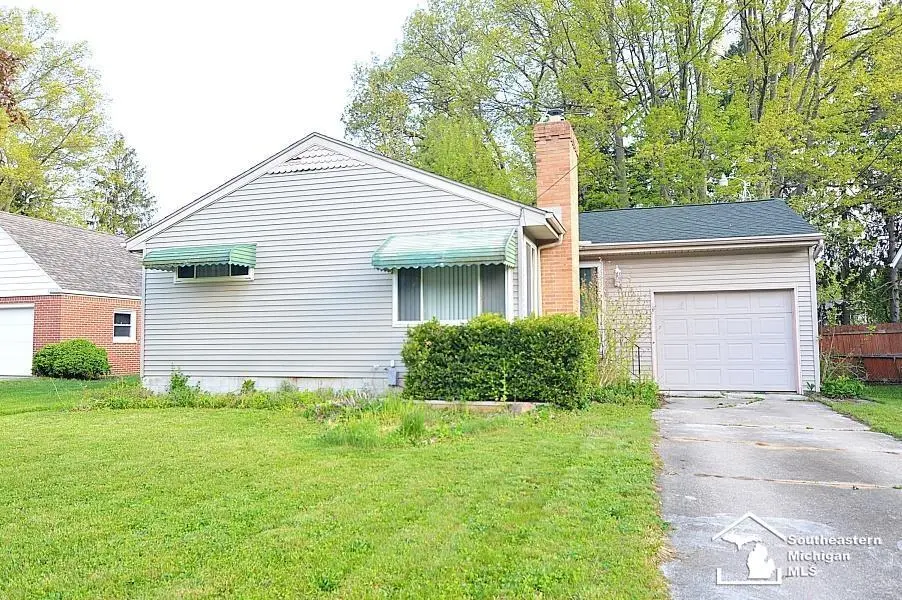
1112 S Park Dr
Temperance, MI 48182
$160,000D
2 bd · 1.0 ba ·
896 sqft ·
Built 1957
· SingleFamily
· Pending
· 3 DOM
Cashflow @ list (25.0% down · 7.5%)
Estimated rent
$1,195/mo
Mortgage (P&I)
−$839
Tax + insurance
−$112
HOA
−$0
Vac / Maint / Mgmt
−$251
Net cashflow
$-7/mo
Annual
$-89/yr
Cap rate
6.24%
Cash-on-cash
-0.20%
DSCR
0.99
1% rule
0.75%
Cash to close
$44,800
Investor read
- This is a 2-bed/1.0-bath single-family listed at $160k.
- At list price, monthly cash flow is $-7 ($-89/yr) — negative.
- To cash-flow at today's rent, offer at most $159k (0.8% below list).
- To meet the 1% rule (rent ≥ 1% of price), the offer needs to be $120k (25.3% below list).
- Only 3 days on market — expect competitive offers; lowballing is unlikely to land.
- Recommended offer: $120k (25.3% below list) — sets the bar for 1% rule.
- Local home prices are declining (-3.0%/yr); year-one equity from $1k of loan paydown is wiped out by about $5k of value loss. Plan a longer hold.
- Location reads 72/100 on livability (#229 in MI) — a middle-class / working-renter tenant base. Strengths: employment A+, cost of living A+, housing A+; Watch: amenities F, commute F, health & safety F.
- Bedford Public Schools (suburban): math 33% / reading 53% proficiency, ranked #150 of 540 in MI (top 28%) — families likely to look elsewhere, expect single-tenant / working-renter base with shorter leases; only 18% free/reduced lunch — higher-income household profile.
- Zoned schools: Monroe Road Elementary School (math 29% / reading 54%, grade F, #581 of 1,397 statewide, top 42%, 613 students, 25% FRL); Bedford Junior High School (math 30% / reading 52%, grade F, #195 of 493 statewide, top 41%, 911 students, 29% FRL); Bedford Senior High School (math 38% / reading 64%, grade D+, #142 of 713 statewide, top 20%, 1,294 students, 27% FRL).
- Watch-outs: built in 1957 — expect roof / HVAC / electrical / plumbing capex.
- Market conditions: 82 active listings in the ZIP; 1 comparable units currently listed for rent nearby; solid renter incomes; 264 units permitted in Monroe County in 2024 (40 in 5+ unit buildings).
- Monroe County population projected at -20% by 2050 — secular population decline; favor cash flow + early exit over multi-decade hold.
- 2 sale attempts with the ask held roughly flat each time — persistent listings suggest the price (not the market) is what's stuck; bring a comps-based counter.
- This rent is only 17% of the median local income ($83k/yr) — well below the 30% rent-burden line; pricing power to push rent on renewal without tenant pushback.
Questions for listing agent
- What do current leases actually rent for vs. the listed asking? Can we see a recent rent roll and the last 12 months of T-12 income?
- Built in 1957 — when were the roof, HVAC, electrical panel, plumbing, and water heater last replaced?
- Is there a deadline driving the sale (1031 exchange, divorce, estate, relocation)? That informs how much negotiation room exists.
- The area grade is low — what's the realistic commute time and amenity access for the typical tenant pool here? Any planned neighborhood developments (good or bad) we should know about?
- What's the average days-on-market for RENTAL listings here right now (not sales)? A rising rental-DOM trend means longer vacancies and softer asking-rent achievability than the comps imply.
- What's the recent tenant-quality profile in this submarket — average credit score on applications, eviction rate, late-payment / NSF rate, and stable-employment percentage? A property-management company in the area should have these aggregated.
- How much new for-sale + rental construction is in the pipeline within 1–3 miles? Heavy new supply typically softens prices + rents 12–24 months out; constrained supply supports both.
CashFlowRE · CFR-X9E2H9FDKSYWR3
· Data 3 weeks ago
cashflowre.app · 2026-05-29