5122 Pebble Ln
Loves Park, IL 61111
$60,000C+
3 bd · 1.0 ba ·
1,190 sqft ·
Built 1996
· Manufactured
· Active
· 11 DOM
Cashflow @ list (25.0% down · 7.5%)
Estimated rent
$1,250/mo
Mortgage (P&I)
−$315
Tax + insurance
−$100
HOA
−$0
Vac / Maint / Mgmt
−$262
Net cashflow
$573/mo
Annual
$6,874/yr
Cap rate
17.75%
Cash-on-cash
40.92%
DSCR
2.82
1% rule
2.08%
Cash to close
$16,800
Investor read
- This is a 3-bed/1.0-bath manufactured listed at $60k. Condition is rated fair.
- At list price, monthly cash flow is $573 ($7k/yr) — positive.
- The deal already cash-flows at list — no discount required.
- Meets the 1% rule at list price ($1k rent vs $60k).
- Only 11 days on market — expect competitive offers; lowballing is unlikely to land.
- Local home prices are declining (-3.0%/yr); year-one equity from $415 of loan paydown is wiped out by about $2k of value loss. Plan a longer hold.
- Location reads 74/100 on livability (#255 in IL, #4,724 nationally) — a middle-class / working-renter tenant base. Strengths: cost of living A+, housing A+, health & safety A+; Watch: employment D+, commute F.
- Harlem UD 122 (suburban): math 17% / reading 23% proficiency, ranked #418 of 620 in IL (top 67%) — low school quality limits family demand, transient renter base, plan for 1-2y turnover.
- Zoned schools: Rock Cut Elem School (math 13% / reading 21%, grade F, #1,141 of 2,056 statewide, top 59%, 407 students, 0% FRL); Harlem High School (math 18% / reading 23%, grade F, #350 of 693 statewide, top 51%, 1,875 students, 0% FRL) — zoned schools average 0% FRL vs 45% district-wide (45 pts lower); this property's tenant base skews higher-income than the district average.
- Market conditions: 91 active listings in the ZIP; 2 comparable units currently listed for rent nearby; 285 units permitted in Winnebago County in 2024 (0 in 5+ unit buildings).
- Winnebago County population projected at -20% by 2050 — secular population decline; favor cash flow + early exit over multi-decade hold.
- At projected returns (-3.0% appreciation + 3.0% rent growth), your $17k cash investment doubles in ~3 years — after that, you're playing with house money.
- Cap rate 17.8% vs local median 4.9% in Loves Park — top-decile yield for the area; either an underpriced asset or a hidden risk that comps aren't pricing in. Stress-test before assuming the spread holds.
Questions for listing agent
- Have any recent inspections been done? Can we get a copy of the seller's disclosures and any deferred-maintenance estimates?
- Is there a deadline driving the sale (1031 exchange, divorce, estate, relocation)? That informs how much negotiation room exists.
- Schools are F-rated, which usually means shorter tenancies and higher turnover. Who's the typical renter profile here, and what's been the actual vacancy rate?
- What's the average days-on-market for RENTAL listings here right now (not sales)? A rising rental-DOM trend means longer vacancies and softer asking-rent achievability than the comps imply.
- What's the recent tenant-quality profile in this submarket — average credit score on applications, eviction rate, late-payment / NSF rate, and stable-employment percentage? A property-management company in the area should have these aggregated.
- How much new for-sale + rental construction is in the pipeline within 1–3 miles? Heavy new supply typically softens prices + rents 12–24 months out; constrained supply supports both.
Repairs flagged (vision-AI assessment)
- Moderate: kitchen cabinets — dated and in need of replacement
- Moderate: bathroom fixtures — outdated and in need of replacement
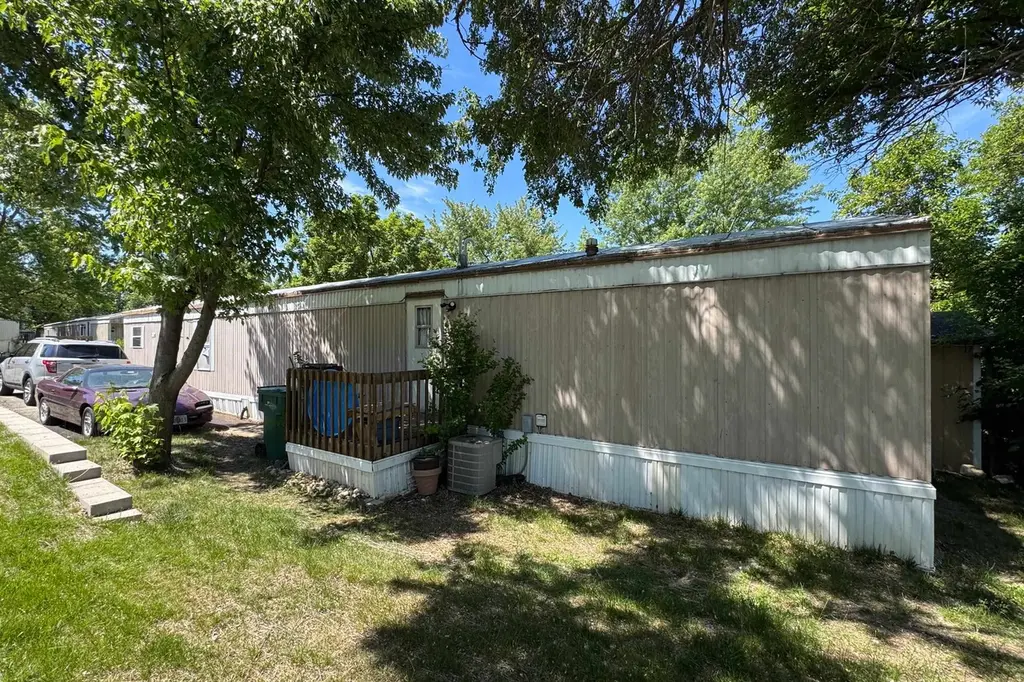
- Minor: exterior siding — some wear
CashFlowRE · CFR-XAE7FH3VGMMTJG
· Data 1 day ago
cashflowre.app · 2026-05-29