5122 Pebble Ln · Loves Park, IL
Flood risk 1/10 · Minimal
- FEMA flood zone
- X (unshaded)
- Chance of flooding over 30 yrs
- 0.0%
- Est. flood insurance / yr
- $507 – $1,088
Fire risk 1/10 · Minimal
- Est. fire insurance / yr
- $804 – $1,492
Heat risk 2/10 · Minimal
- Hot days now (above 101°F)
- 7 days/yr
- Hot days in 30 yrs
- 15 days/yr
Wind risk 2/10 · Minimal
- Chance of severe wind over 30 yrs
- —
Air-quality risk 3/10 · Minor
- Unhealthy air days now
- 2 days/yr
- Unhealthy air days in 30 yrs
- 3 days/yr
Risk factors via First Street. Map © Google.
Why this score? — see what drove the C+ grade
The composite is a weighted blend of 9 inputs, each scored 0–100. Each bar is that input's sub-score; the figure is the points it added to the 100-point composite (weight × sub-score).
- Cash flow +30.0/30.0
- 1% rule +10.0/10.0
- DSCR +10.0/10.0
- Livability +3.7/5.0
- Rent growth +2.5/5.0
- Condition / age +2.2/5.0
- Schools +1.8/10.0
- ARV discount +0.0/15.0
- Appreciation +0.0/10.0
$60,000
🖨 Deal sheet 📄 Offer letter ✓ Due diligence
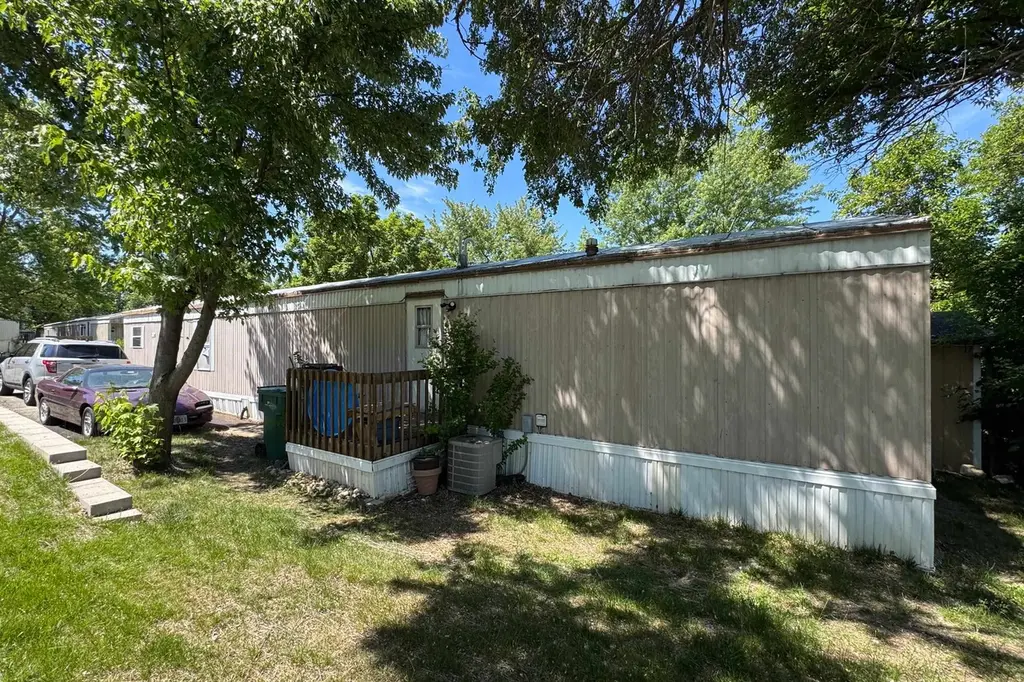
Listing remarks
Your low-maintenance Loves Park home base comes with built-in summer plans! Positioned perfectly within a community that treats you to an inviting neighborhood pool and green park spaces, this 1996-built manufactured residence delivers effortless lifestyle perks. Inside the 1,190-square-foot floor plan, daily life centers around an airy, connected living room and kitchen zone that keeps everyone in the conversation. Three well-proportioned bedrooms offer quiet retreats, all anchored by a central full bathroom. Step through the door onto your private outdoor deck, a stellar spot for morning coffee before heading out to enjoy the community amenities. Practical highlights include a durable met
Key facts
- Durable metal roof
- Neighborhood pool
- Green park spaces
Tags
Property features AI
Exterior
- Utilities: Public water; Public sewer
- Home design: Residential mobile home
- Exterior features: Metal roof
Interior
- Kitchen: Gas cooktop; Dishwasher; Refrigerator
- Bathrooms: 1 full bathroom (main level)
- Heating & cooling: Natural gas heating; Central air conditioning
- Interior features: Gas cooktop; Dishwasher; Refrigerator; Gas water heater
- Laundry & utility: Washer
Neighborhood map
What this means for you Summary
Snapshot
- This is a 3-bed/1.0-bath manufactured listed at $60k. Condition is rated fair.
Deal economics
- At list price, monthly cash flow is $573 ($7k/yr) — positive.
- The deal already cash-flows at list — no discount required.
- Meets the 1% rule at list price ($1k rent vs $60k).
- Cap rate 17.8% vs local median 4.9% in Loves Park — top-decile yield for the area; either an underpriced asset or a hidden risk that comps aren't pricing in. Stress-test before assuming the spread holds.
Location & tenants
- Location reads 74/100 on livability (#255 in IL, #4,724 nationally) — a middle-class / working-renter tenant base. Strengths: cost of living A+, housing A+, health & safety A+; Watch: employment D+, commute F.
- Harlem UD 122 (suburban): math 17% / reading 23% proficiency, ranked #418 of 620 in IL (top 67%) — low school quality limits family demand, transient renter base, plan for 1-2y turnover.
- Zoned schools: Rock Cut Elem School (math 13% / reading 21%, grade F, #1,141 of 2,056 statewide, top 59%, 407 students, 0% FRL); Harlem High School (math 18% / reading 23%, grade F, #350 of 693 statewide, top 51%, 1,875 students, 0% FRL) — zoned schools average 0% FRL vs 45% district-wide (45 pts lower); this property's tenant base skews higher-income than the district average.
- Market conditions: 91 active listings in the ZIP; 2 comparable units currently listed for rent nearby; 285 units permitted in Winnebago County in 2024 (0 in 5+ unit buildings).
Forward outlook
- Local home prices are declining (-3.0%/yr); year-one equity from $415 of loan paydown is wiped out by about $2k of value loss. Plan a longer hold.
- Winnebago County population projected at -20% by 2050 — secular population decline; favor cash flow + early exit over multi-decade hold.
- At projected returns (-3.0% appreciation + 3.0% rent growth), your $17k cash investment doubles in ~3 years — after that, you're playing with house money.
Negotiation context
- Only 11 days on market — expect competitive offers; lowballing is unlikely to land.
Questions for the listing agent
- Have any recent inspections been done? Can we get a copy of the seller's disclosures and any deferred-maintenance estimates?
- Is there a deadline driving the sale (1031 exchange, divorce, estate, relocation)? That informs how much negotiation room exists.
- Schools are F-rated, which usually means shorter tenancies and higher turnover. Who's the typical renter profile here, and what's been the actual vacancy rate?
- What's the average days-on-market for RENTAL listings here right now (not sales)? A rising rental-DOM trend means longer vacancies and softer asking-rent achievability than the comps imply.
- What's the recent tenant-quality profile in this submarket — average credit score on applications, eviction rate, late-payment / NSF rate, and stable-employment percentage? A property-management company in the area should have these aggregated.
- How much new for-sale + rental construction is in the pipeline within 1–3 miles? Heavy new supply typically softens prices + rents 12–24 months out; constrained supply supports both.
Investment metrics
- 1% rule
- 2.08% ✓
- Cap rate
- 17.75%
- Cash-on-cash
- 40.92%
- DSCR
- 2.82
- GRM
- 4.0
CMA / ARV
- ARV (on-the-fly)
- $48,790
- Comps found
- 2
Show comp detail 2 sales within ~0.75 mi
| Address | Dist | Beds/Ba | Sqft | Sold | Price | $/sf | Match |
|---|---|---|---|---|---|---|---|
| 5228 Marble Dr | 0.22mi | 3/2.0 | 1,344 (+13%) | 2mo | $55,000 | $41 | 63 |
| 5633 Rockport Rd | 0.47mi | 3/2.0 | 1,344 (+13%) | 19mo | $50,000 | $37 | 36 |
Match score weights: distance 35% · size 25% · config 20% · recency 20%. Top-matched comps best support the ARV.
Projected returns pro-forma
-3.0% appreciation · 3.0% rent growth · sell at horizon
- IRR
- 37.4%
- Equity multiple
- 2.59×
- Total profit
- $26,782
- Equity at exit
- $8,946
- IRR
- 44.0%
- Equity multiple
- 5.19×
- Total profit
- $70,378
- Equity at exit
- $5,188
Cash invested: $16,800 (down + closing). Projections, not guarantees.
Landlord ↔ Tenant lean methodology
- Overall (STATE)
- 43 Moderately Tenant-Leaning
- State Illinois
- 43 Moderately Tenant-Leaning · D+7
- County
- — inherits STATE
- City
- — inherits STATE
ZIP-level market 61111
- Active inventory
- 91
- Price-to-rent
- 4.0×
Monthly cashflow live
- Estimated rent
- $1,250 medium interval (Pro) →
- Mortgage (P&I)
- −$315
- Tax est. 1.5%
- −$75 /mo · $900/yr
- Insurance
- −$25
- HOA
- −$0
- Vacancy / Maint / Mgmt
- −$262
- Net cashflow
- $573
Break-even live
UW: 25.0% down · 7.5% · 30yr · 1.5% tax · 5.0% vac · 8.0% maint · 8.0% mgmt
Financing live
Cash to close
- Down payment
- $15,000
- Closing costs
- $1,800
- Reserves months
- —
- Total cash needed
- —
Loan-product check · same deal, 3 products live
Conventional
25% down · 7.5% · 30yr
- Down + closing
- —
- Monthly P&I
- —
- Monthly cashflow
- —
- DSCR
- —
- Eligible?
- —
Personal DTI + credit; lowest rate.
DSCR
20% down · 8.5% · 30yr
- Down + closing
- —
- Monthly P&I
- —
- Monthly cashflow
- —
- DSCR
- —
- Eligible?
- —
No personal income docs; deal must DSCR.
Hard money
10% down · 12.0% · 12mo
- Down + closing
- —
- Monthly P&I
- —
- Monthly cashflow
- —
- DSCR
- —
- Eligible?
- —
Short-term bridge; refi at stabilization.
Rent comps 2 comps
| Address | Beds | Baths | Sqft | Rent | $/sqft | DOM | Units | Dist |
|---|---|---|---|---|---|---|---|---|
| 4041 Rennhart Loves Park, IL | 1.0–2.0 | 1.0 | 1027 | $1,250 | $1.22 | 13d | 5 | 0.52mi |
| 7705 Randy Rd Machesney Park, IL | 3.0 | 1.0 | 760 | $1,250 | $1.64 | 13d | 1 | 1.36mi |
Listing history 10 events
-
2026-06-19days on market $60,000 Active 11 DOM
-
2026-06-18days on market $60,000 Active 10 DOM
-
2026-06-17days on market $60,000 Active 9 DOM
-
2026-06-16days on market $60,000 Active 8 DOM
-
2026-06-15days on market $60,000 Active 7 DOM
-
2026-06-14days on market $60,000 Active 5 DOM
-
2026-06-13days on market $60,000 Active 4 DOM
-
2026-06-10days on market $60,000 Active 2 DOM
-
2026-06-09remarks 699-char remark
-
2026-06-09$60,000 Active 1 DOM
ⓘ Source: listings_history table (triggers on properties + properties_extension) + one-shot
backfill from property_details.listing_events for pre-trigger history.
Climate risk First Street
- Flood 1/10 Low FEMA zone X (unshaded) · 0% chance over 30 yrs
- Wildfire 1/10 Low
- Heat 2/10 Low 7 d/yr ≥101°F today · 15 d/yr by 30 yrs out
- Wind 2/10 Low
- Air quality 3/10 Moderate 2 unhealthy d/yr today · 3 by 30 yrs out
Nearby sold comps map
Loading sold comps map…
Walkable amenities ~0.75 mi
Loading nearby amenities…
Taxation est. · year 1
- Rental income
- $15,000
- − Mortgage interest
- −$3,361
- − Property taxes
- −$900
- − Insurance
- −$300
- − Repairs & maintenance
- −$1,200
- − Management
- −$1,200
- − Depreciation
- −$1,745
- Taxable income
- $6,294
- Est. tax owed @ 24.0%
- −$1,510
- After-tax cash flow
- $5,364/yr
For passive investors: Depreciation is non-cash, so a rental often shows a tax loss while cash-flowing — sheltering income. Rental losses are passive: they offset passive income freely, and up to $25,000/yr can offset ordinary (W-2) income if you actively participate and your MAGI is under $100k (phasing out to $0 by $150k); unused losses carry forward. On sale, claimed depreciation is recaptured at up to 25%, and gains may owe capital-gains tax (a 1031 exchange can defer both). Figures are a year-1 estimate at your 24.0% rate — not tax advice; consult a CPA.
Condition & rehab AI · 12 photos
This manufactured home requires moderate renovations to update the kitchen and bathroom, paint interior walls, and replace carpeted flooring. These updates will significantly increase its resale and rental value.
Repairs flagged
- Moderate kitchen cabinets — dated and in need of replacement
- Moderate bathroom fixtures — outdated and in need of replacement
- Minor exterior siding — some wear
Value-add opportunities
- Both update kitchen cabinets and fixtures — modernizing the kitchen will increase both resale and rental value
- Both paint interior walls — fresh paint will improve the home's curb appeal and interior aesthetics
- Both replace carpeted flooring with hardwood or tile — hardwood or tile flooring will increase both resale and rental value
- Both repair/replace exterior siding — repairing or replacing the siding will improve the home's curb appeal and increase its value
Renovation cost estimate screening
| Repair item | Severity | Est. cost |
|---|---|---|
| kitchen cabinets · dated and in need of replacement | Moderate | $3,000–15,000 |
| bathroom fixtures · outdated and in need of replacement | Moderate | $3,000–15,000 |
| exterior siding · some wear | Minor | $500–3,000 |
| Total estimated repair cost · 3 items | $6,500–33,000 |
Value-add ROI direction
- Both update kitchen cabinets and fixtures — modernizing the kitchen will increase both resale and rental value ↑
- Both paint interior walls — fresh paint will improve the home's curb appeal and interior aesthetics ↑
- Both replace carpeted flooring with hardwood or tile — hardwood or tile flooring will increase both resale and rental value ↑
- Both repair/replace exterior siding — repairing or replacing the siding will improve the home's curb appeal and increase its value ↑
ⓘ Cost ranges are severity-bucket heuristics (US national rule-of-thumb). Get contractor quotes + a written scope before underwriting a rehab budget.
Schools (NCES district)
- District
- Harlem UD 122
- NCES district ID
- 1718240
- Math proficiency
- 17% ▼ -8.00%
- Reading proficiency
- 23% ▼ -7.00%
- Median HH income
- $51,228
- Composite
- 18.01/100
- National rank
- #8982
- State rank
- #418 of 620 in IL
Livability — Loves Park
- Score
- 74/100
- State rank
- #255
- US rank
- #4724
Category grades
Schools grade is shown separately in the Schools card above.
Census & demographics
- Census place
- Loves Park, IL
- City population
- 22,838
- Population (ZIP)
- 22,838
Population outlook (Winnebago County) Hauer SSP2
- Today (2025)
- 271,080 people
- By 2030
- 260,684 · -3.8%
- By 2040
- 238,405 · -12.1%
- By 2050
- 216,129 · -20.3%
- By 2075
- 172,882 · -36.2%
- By 2100
- 135,336 · -50.1%
Race, ethnicity, and origin ACS 2023
- Neighborhood character
- Predominantly White (70%)
- Race & ethnicity
- White 70% Two or more races 11% Hispanic / Latino 9% Black 8% Asian 4%
- Hispanic origin (detail)
- Mexican 7% Puerto Rican 1%
- Common ancestry
- Romanian 4% Portuguese 3% Slovak 2%
- Foreign-born
- 8% · Canada, China
- Languages at home
- 89% English-only · Spanish 5% Russian/Polish/Slavic 3% Other Indo-European 1%
Political lean MEDSL · Winnebago
- 2024 margin
- Toss-up / Even · D 49.5% · R 49.0% · Other 1.5%
- 2008→2024 swing
- -12.2pp toward R · 2008: 12.8pp · 2024: 0.6pp
- All cycles
- 2024: D+0.6 2020: D+2.5 2016: R+1.2 2012: D+5.7 2008: D+12.8
Not yet ingested
- Civics
- —
Market trends
- HPI YoY
- ▼ -125.48%
- Current HPI
- 222.3872
- Rent YoY
- —
- Metro
- —
- State GDP YoY
- ▲ 1.59%
- F500 in state
- 60
Industry mix (Fortune 500 HQ in IL)
| Industry | F500 HQs | Revenue |
|---|---|---|
| Insurance | 4 | $201B |
|
||
| Consumer Goods | 4 | $87B |
|
||
| Industrial Machinery | 3 | $64B |
|
||
| Healthcare | 2 | $55B |
|
||
| Retail / Pharmacy | 1 | $148B |
|
||
| Agriculture / Food | 1 | $86B |
|
||
Price history
1 event — show timeline
- 2026-06-08 Listed $60,000 NWIAR
Cash-flow waterfall
monthlySold comps — $/sqft
last 12 mo · ≤1 miLoading sold comps…