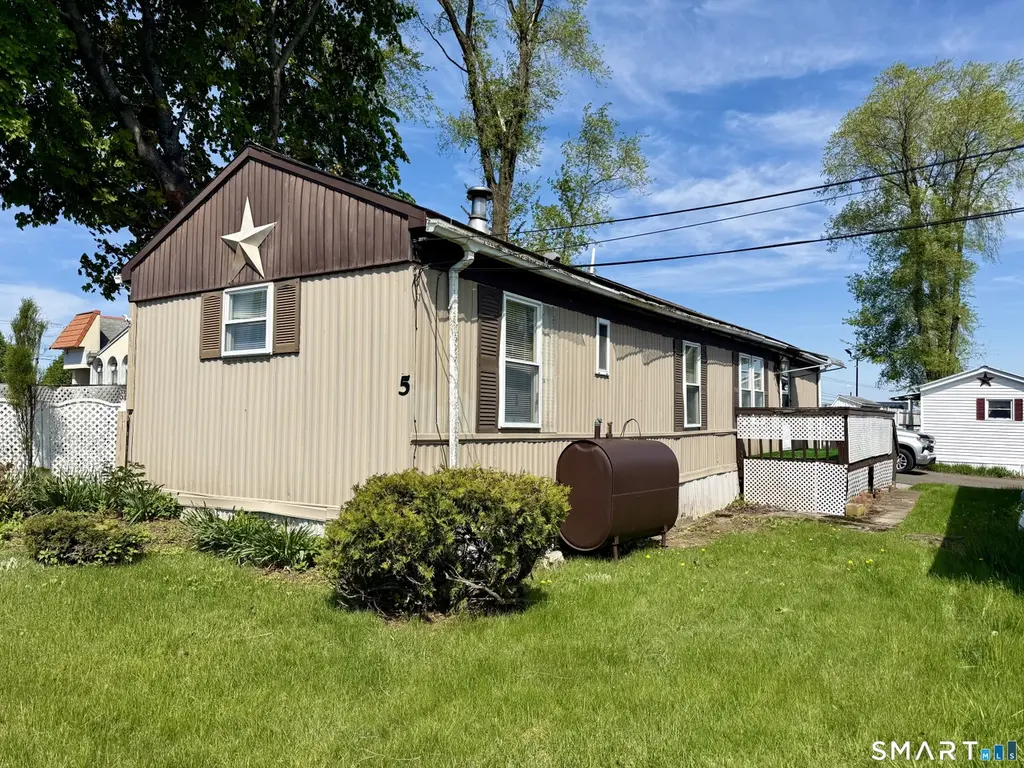
9 North Rd
Southwood Acres, CT 06088
$69,900B-
2 bd · 1.0 ba ·
728 sqft ·
Built 1978
· Manufactured
· Active
· 42 DOM
Cashflow @ list (25.0% down · 7.5%)
Estimated rent
$1,692/mo
Mortgage (P&I)
−$367
Tax + insurance
−$84
HOA
−$482
Vac / Maint / Mgmt
−$355
Net cashflow
$404/mo
Annual
$4,846/yr
Cap rate
13.23%
Cash-on-cash
24.76%
DSCR
2.10
1% rule
2.42%
Cash to close
$19,572
Investor read
- This is a 2-bed/1.0-bath manufactured listed at $70k.
- At list price, monthly cash flow is $404 ($5k/yr) — positive.
- The deal already cash-flows at list — no discount required.
- Meets the 1% rule at list price ($2k rent vs $70k).
- It's been on market 42 days — a 3% lower offer ($68k) is reasonable based on typical stale-listing flexibility.
- Recommended offer: $68k (3.0% below list) — sets the bar for market timing.
- Local home prices are declining (-3.0%/yr); year-one equity from $483 of loan paydown is wiped out by about $2k of value loss. Plan a longer hold.
- Location reads 72/100 on livability (#83 in CT) — a middle-class / working-renter tenant base. Strengths: employment A+, housing A+, crime A; Watch: cost of living C-, amenities F, commute F.
- East Windsor School District (rural): math 21% / reading 40% proficiency, ranked #120 of 153 in CT (top 78%) — families likely to look elsewhere, expect single-tenant / working-renter base with shorter leases.
- Zoned schools: Broad Brook Elementary School (math 27% / reading 37%, grade F, #361 of 553 statewide, top 68%, 428 students, 44% FRL); East Windsor Middle School (math 19% / reading 39%, grade F, #143 of 175 statewide, top 83%, 324 students, 60% FRL); East Windsor High School (math 22% / reading 52%, grade F, #112 of 194 statewide, top 60%, 257 students, 57% FRL) — zoned schools average 54% FRL vs 32% district-wide (21 pts higher); higher-poverty schools than district average — tighter screening recommended.
- Watch-outs: HOA is 28% of rent.
- Market conditions: 38 active listings in the ZIP; 5 comparable units currently listed for rent nearby; rentals at typical pace (median 26d on market — plan ~3-4 weeks tenant-placement turnaround); 1,867 units permitted in Capitol Planning Region in 2024 (1,399 in 5+ unit buildings).
- 4 sale attempts since 16y ago with the ask held roughly flat each time — persistent listings suggest the price (not the market) is what's stuck; bring a comps-based counter.
- Current owner paid $11k; list at $70k implies a 550% gain — meaningful room to come down on a strong offer.
- At projected returns (-3.0% appreciation + 3.0% rent growth), your $20k cash investment doubles in ~5 years — after that, you're playing with house money.
- Cap rate 13.2% vs local median 4.2% in Southwood Acres — top-decile yield for the area; either an underpriced asset or a hidden risk that comps aren't pricing in. Stress-test before assuming the spread holds.
Questions for listing agent
- It's been on market 42 days. Have you received any prior offers? Is the seller open to a 3% concession, seller financing, or rate buy-down credit?
- Built in 1978 — when were the roof, HVAC, electrical panel, plumbing, and water heater last replaced?
- What does the HOA fee cover, when was the last increase, and are there any pending special assessments or reserve-fund shortfalls?
- Is there a deadline driving the sale (1031 exchange, divorce, estate, relocation)? That informs how much negotiation room exists.
- What's the average days-on-market for RENTAL listings here right now (not sales)? A rising rental-DOM trend means longer vacancies and softer asking-rent achievability than the comps imply.
- What's the recent tenant-quality profile in this submarket — average credit score on applications, eviction rate, late-payment / NSF rate, and stable-employment percentage? A property-management company in the area should have these aggregated.
- How much new for-sale + rental construction is in the pipeline within 1–3 miles? Heavy new supply typically softens prices + rents 12–24 months out; constrained supply supports both.
CashFlowRE · CFR-XB9S30BNH6Y2GB
· Data 18 h ago
cashflowre.app · 2026-05-29