9 North Rd · Southwood Acres, CT
Flood risk No data
- FEMA flood zone
- —
- Chance of flooding over 30 yrs
- —
- Est. flood insurance / yr
- —
Fire risk No data
- Est. fire insurance / yr
- —
Heat risk No data
- Hot days now (above threshold)
- —
- Hot days in 30 yrs
- —
Wind risk No data
- Chance of severe wind over 30 yrs
- —
Air-quality risk No data
- Unhealthy air days now
- —
- Unhealthy air days in 30 yrs
- —
Risk factors via First Street. Map © Google.
Why this score? — see what drove the B- grade
The composite is a weighted blend of 9 inputs, each scored 0–100. Each bar is that input's sub-score; the figure is the points it added to the 100-point composite (weight × sub-score).
- Cash flow +30.0/30.0
- 1% rule +10.0/10.0
- DSCR +10.0/10.0
- ARV discount +7.5/15.0
- Livability +3.6/5.0
- Schools +2.8/10.0
- Rent growth +2.5/5.0
- Condition / age +2.5/5.0
- Appreciation +0.0/10.0
$69,900
🖨 Deal sheet (PDF) 📄 Offer letter ✓ Due diligence
Listing remarks
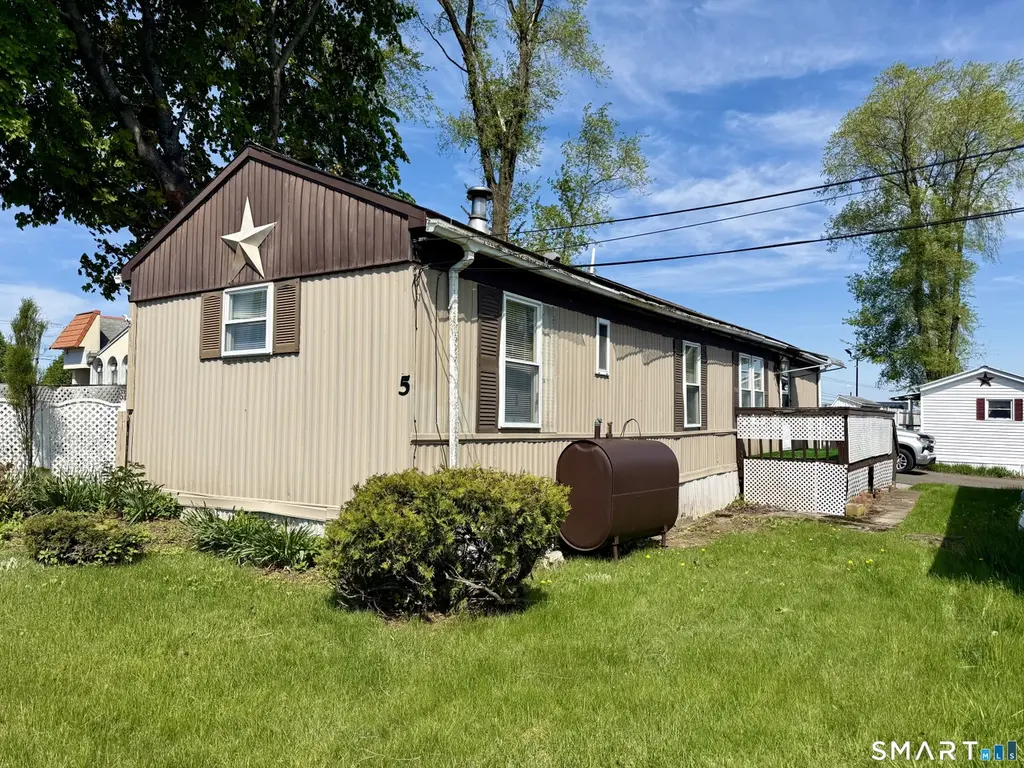
Welcome to Lata's Mobile Home Park! This 1978 Titan manufactured home offers an affordable homeownership opportunity with plenty of potential to make it your own. Featuring 2 bedrooms, 1 full bathroom, and approximately 784 sq. ft. of living space 14' x 56', this home is move in ready while providing the perfect opportunity for cosmetic updates and personal touches. Inside, you'll find a spacious living room filled with natural light that flows into the eat in kitchen featuring ample cabinetry, generous counter space, and included appliances. The layout offers comfortable single level living with a nicely sized primary bedroom, a second bedroom ideal for guests or office space, and a full b
Key facts
- Ample cabinetry
- Eat in kitchen
- Single level living
Tags
Property features AI
Finance
- HOA & community: Homeowners association with monthly fee; HOA fee covers property management and road maintenance
Exterior
- Parking: On-street parking; 1 parking space
- Utilities: Public water connected; Public sewer connected; Electric hot water
- Home design: Single-family home; On leased land; Beige exterior
- Construction: Prefabricated construction; Asphalt shingle roof; No foundation listed
- Exterior features: Zero lot line; Rear lot; Cleared lot; Aluminum siding
Interior
- Kitchen: Gas range; Microwave; Refrigerator
- Bedrooms: 2 bedrooms
- Bathrooms: 1 full bathroom
- Heating & cooling: Hot air heating; Kerosene and oil fuel; Window air-conditioning unit; Above-ground fuel tank; Electric hot water
- Interior features: Cable available; Total of 5 rooms; No basement
- Laundry & utility: Washer; Electric dryer
Neighborhood map
What this means for you Summary
Snapshot
- This is a 2-bed/1.0-bath manufactured listed at $70k.
Deal economics
- At list price, monthly cash flow is $404 ($5k/yr) — positive.
- The deal already cash-flows at list — no discount required.
- Meets the 1% rule at list price ($2k rent vs $70k).
- Recommended offer: $68k (3.0% below list) — sets the bar for market timing.
- Cap rate 13.2% vs local median 4.2% in Southwood Acres — top-decile yield for the area; either an underpriced asset or a hidden risk that comps aren't pricing in. Stress-test before assuming the spread holds.
Location & tenants
- Location reads 72/100 on livability (#83 in CT) — a middle-class / working-renter tenant base. Strengths: employment A+, housing A+, crime A; Watch: cost of living C-, amenities F, commute F.
- East Windsor School District (rural): math 21% / reading 40% proficiency, ranked #120 of 153 in CT (top 78%) — families likely to look elsewhere, expect single-tenant / working-renter base with shorter leases.
- Zoned schools: Broad Brook Elementary School (math 27% / reading 37%, grade F, #361 of 553 statewide, top 68%, 428 students, 44% FRL); East Windsor Middle School (math 19% / reading 39%, grade F, #143 of 175 statewide, top 83%, 324 students, 60% FRL); East Windsor High School (math 22% / reading 52%, grade F, #112 of 194 statewide, top 60%, 257 students, 57% FRL) — zoned schools average 54% FRL vs 32% district-wide (21 pts higher); higher-poverty schools than district average — tighter screening recommended.
- Market conditions: 38 active listings in the ZIP; 5 comparable units currently listed for rent nearby; rentals at typical pace (median 26d on market — plan ~3-4 weeks tenant-placement turnaround); 1,867 units permitted in Capitol Planning Region in 2024 (1,399 in 5+ unit buildings).
Forward outlook
- Local home prices are declining (-3.0%/yr); year-one equity from $483 of loan paydown is wiped out by about $2k of value loss. Plan a longer hold.
- At projected returns (-3.0% appreciation + 3.0% rent growth), your $20k cash investment doubles in ~5 years — after that, you're playing with house money.
Negotiation context
- It's been on market 42 days — a 3% lower offer ($68k) is reasonable based on typical stale-listing flexibility.
- 4 sale attempts since 16y ago with the ask held roughly flat each time — persistent listings suggest the price (not the market) is what's stuck; bring a comps-based counter.
- Current owner paid $11k; list at $70k implies a 550% gain — meaningful room to come down on a strong offer.
Risks & watch-outs
- Watch-outs: HOA is 28% of rent.
Questions for the listing agent
- It's been on market 42 days. Have you received any prior offers? Is the seller open to a 3% concession, seller financing, or rate buy-down credit?
- Built in 1978 — when were the roof, HVAC, electrical panel, plumbing, and water heater last replaced?
- What does the HOA fee cover, when was the last increase, and are there any pending special assessments or reserve-fund shortfalls?
- Is there a deadline driving the sale (1031 exchange, divorce, estate, relocation)? That informs how much negotiation room exists.
- What's the average days-on-market for RENTAL listings here right now (not sales)? A rising rental-DOM trend means longer vacancies and softer asking-rent achievability than the comps imply.
- What's the recent tenant-quality profile in this submarket — average credit score on applications, eviction rate, late-payment / NSF rate, and stable-employment percentage? A property-management company in the area should have these aggregated.
- How much new for-sale + rental construction is in the pipeline within 1–3 miles? Heavy new supply typically softens prices + rents 12–24 months out; constrained supply supports both.
Investment metrics
- 1% rule
- 2.42% ✓
- Cap rate
- 13.23%
- Cash-on-cash
- 24.76%
- DSCR
- 2.10
- GRM
- 3.4
CMA / ARV
- ARV (median comp)
- $268,020
- List price
- $69,900
- Delta
- -73.92%
- Verdict
- UNDERPRICED
- Comps
- 14 within 1.0 mi
Projected returns pro-forma
-3.0% appreciation · 3.0% rent growth · sell at horizon
- IRR
- 18.5%
- Equity multiple
- 1.75×
- Total profit
- $14,698
- Equity at exit
- $10,422
- IRR
- 27.0%
- Equity multiple
- 3.41×
- Total profit
- $47,147
- Equity at exit
- $6,044
Cash invested: $19,572 (down + closing). Projections, not guarantees.
Landlord ↔ Tenant lean methodology
- Overall (STATE)
- 27 Tenant-Leaning
- State Connecticut
- 27 Tenant-Leaning · D+7
- County
- — inherits STATE
- City
- — inherits STATE
ZIP-level market 06088
- Home prices YoY
- -29.3%
- Active inventory
- 38
- Price-to-rent
- 3.4×
Monthly cashflow live
- Estimated rent
- $1,692 high interval (Pro) →
- Mortgage (P&I)
- −$367
- Tax from tax record
- −$55 /mo · $661/yr
- Insurance
- −$29
- HOA
- −$482
- Vacancy / Maint / Mgmt
- −$355
- Net cashflow
- $404
Break-even live
Sensitivity live
| Price | -10% $443 | -5% $424 | +0% $404 | +5% $384 | +10% $364 |
|---|---|---|---|---|---|
| Rent | -10% $270 | -5% $337 | +0% $404 | +5% $471 | +10% $538 |
| Rate | -1.0pp $439 | -0.5pp $422 | base $404 | +0.5pp $386 | +1.0pp $367 |
UW: 25.0% down · 7.5% · 30yr · 1.5% tax · 5.0% vac · 8.0% maint · 8.0% mgmt
Financing live
Cash to close
- Down payment
- $17,475
- Closing costs
- $2,097
- Reserves months
- —
- Total cash needed
- —
Loan-product check · same deal, 3 products live
Conventional
25% down · 7.5% · 30yr
- Down + closing
- —
- Monthly P&I
- —
- Monthly cashflow
- —
- DSCR
- —
- Eligible?
- —
Personal DTI + credit; lowest rate.
DSCR
20% down · 8.5% · 30yr
- Down + closing
- —
- Monthly P&I
- —
- Monthly cashflow
- —
- DSCR
- —
- Eligible?
- —
No personal income docs; deal must DSCR.
Hard money
10% down · 12.0% · 12mo
- Down + closing
- —
- Monthly P&I
- —
- Monthly cashflow
- —
- DSCR
- —
- Eligible?
- —
Short-term bridge; refi at stabilization.
Rent comps 5 comps
| Address | Beds | Baths | Sqft | Rent | $/sqft | DOM | Units | Dist |
|---|---|---|---|---|---|---|---|---|
| 21 Spring St Windsor Locks, CT | 1.0–2.0 | 1.0 | 680 | $2,095 | $3.08 | 3d | 4 | 1.35mi |
| 266 Main St Windsor Locks, CT | 1.0 | 1.0 | 600 | $1,595 | $2.66 | 3d | 1 | 1.43mi |
| 3 North St Unit B-212 Windsor Locks, CT | 1.0 | 1.0 | 700 | $1,690 | $2.41 | 45d | 1 | 1.45mi |
| 3 North St Unit B-105 Windsor Locks, CT | 1.0 | 1.0 | 500 | $1,465 | $2.93 | 25d | 1 | 1.45mi |
| 3 North St Unit O-307 Windsor Locks, CT | 1.0 | 1.0 | 500 | $1,450 | $2.90 | 25d | 1 | 1.45mi |
HOA detail
- Monthly dues
- $482 · $5,784/yr
Listing history 23 events
-
2026-06-21days on market $69,900 Active 42 DOM
-
2026-06-18days on market $69,900 Active 39 DOM
-
2026-06-17days on market $69,900 Active 38 DOM
-
2026-06-16days on market $69,900 Active 37 DOM
-
2026-06-15days on market $69,900 Active 36 DOM
-
2026-06-13days on market $69,900 Active 34 DOM
-
2026-06-13days on market $69,900 Active 33 DOM
-
2026-06-10days on market $69,900 Active 31 DOM
-
2026-06-09days on market $69,900 Active 30 DOM
-
2026-06-08days on market $69,900 Active 29 DOM
-
2026-06-07days on market $69,900 Active 28 DOM
-
2026-06-03days on market $69,900 Active 24 DOM
-
2026-06-02days on market $69,900 Active 23 DOM
-
2026-06-01days on market $69,900 Active 22 DOM
-
2026-05-31days on market $69,900 Active 21 DOM
-
2026-05-10$69,900 Active 1199-char remark
-
2014-11-03soldstatus $10,750
-
2012-12-19historical
-
2012-09-19$45,900
-
2011-07-20historical
-
2011-04-20$37,900
-
2010-07-21historical
-
2010-04-21$39,900
ⓘ Source: listings_history table (triggers on properties + properties_extension) + one-shot
backfill from property_details.listing_events for pre-trigger history.
Tax reassessment forecast CT · Partial reset (capped growth)
- Current annual tax
- $661 · $55/mo
- Projected year-2 tax
- $1,078 · $90/mo
- Expected delta
- +$417/yr (+$35/mo · 63.2%)
ⓘ Screening estimate from a state-policy table — verify with the county assessor before closing.
Nearby sold comps map
Loading sold comps map…
Walkable amenities ~0.75 mi
Loading nearby amenities…
Taxation est. · year 1
- Rental income
- $20,303
- − Mortgage interest
- −$3,915
- − Property taxes
- −$661
- − Insurance
- −$350
- − Repairs & maintenance
- −$1,624
- − Management
- −$1,624
- − HOA
- −$5,784
- − Depreciation
- −$2,033
- Taxable income
- $4,311
- Est. tax owed @ 24.0%
- −$1,035
- After-tax cash flow
- $3,812/yr
For passive investors: Depreciation is non-cash, so a rental often shows a tax loss while cash-flowing — sheltering income. Rental losses are passive: they offset passive income freely, and up to $25,000/yr can offset ordinary (W-2) income if you actively participate and your MAGI is under $100k (phasing out to $0 by $150k); unused losses carry forward. On sale, claimed depreciation is recaptured at up to 25%, and gains may owe capital-gains tax (a 1031 exchange can defer both). Figures are a year-1 estimate at your 24.0% rate — not tax advice; consult a CPA.
Schools (NCES district)
- District
- East Windsor School District
- NCES district ID
- 0901350
- Math proficiency
- 21% ▼ -6.00%
- Reading proficiency
- 40% ▼ -1.00%
- Median HH income
- $69,503
- Composite
- 28.41/100
- National rank
- #6761
- State rank
- #120 of 153 in CT
Livability — Southwood Acres
- Score
- 72/100
- State rank
- #83
- US rank
- #6054
Category grades
Schools grade is shown separately in the Schools card above.
Census & demographics
- Population (ZIP)
- 4,324
Population outlook (Capitol County) Hauer SSP2
- By 2040
- 1,063,519
Race, ethnicity, and origin ACS 2023
- Neighborhood character
- Predominantly White (79%)
- Race & ethnicity
- White 79% Two or more races 8% Hispanic / Latino 8% Asian 7% Black 2%
- Hispanic origin (detail)
- Puerto Rican 5%
- Common ancestry
- Romanian 11% Lithuanian 7% Slovak 2%
- Foreign-born
- 9% · Canada, South Korea
- Languages at home
- 89% English-only · Other Indo-European 4% Spanish 3% Other Asian/Pacific 2%
Political lean MEDSL · Capitol
- 2024 margin
- Strong D (+21.9) · D 60.1% · R 38.2% · Other 1.7%
- All cycles
- 2024: D+21.9
Not yet ingested
- Civics
- —
Market trends
- HPI YoY
- ▼ -78.83%
- Current HPI
- 190.3362
- Rent YoY
- —
- Metro
- —
- State GDP YoY
- ▲ 1.06%
- F500 in state
- 38
Industry mix (Fortune 500 HQ in CT)
| Industry | F500 HQs | Revenue |
|---|---|---|
| Industrial Machinery | 4 | $38B |
|
||
| Insurance | 3 | $71B |
|
||
| Financial Services | 2 | $25B |
|
||
| Transportation / Logistics | 2 | $18B |
|
||
| Healthcare | 1 | $247B |
|
||
| Telecommunications | 1 | $55B |
|
||
Price history
+75.2% since first listed8 events — show timeline
- 2026-05-10 Listed $69,900 Smart MLS
- 2014-11-03 Sold (Public Records) $10,750 Public Records
- 2012-12-19 Listing Removed — Smart MLS
- 2012-09-19 Listed $45,900 Smart MLS
- 2011-07-20 Listing Removed — Smart MLS
- 2011-04-20 Listed $37,900 Smart MLS
- 2010-07-21 Listing Removed — Smart MLS
- 2010-04-21 Listed $39,900 Smart MLS
Property tax history
+3.5%/yrLatest (2025): $661 · +3.3% YoY. Source: county tax records.
Cash-flow waterfall
monthlySold comps — $/sqft
last 12 mo · ≤1 miLoading sold comps…