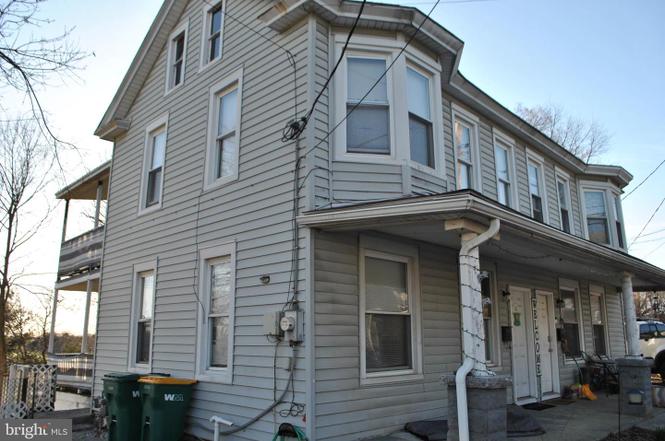
315 S Enola Dr
East Pennsboro, PA 17025
$165,000C+
3 bd · 1.0 ba ·
1,184 sqft ·
Built 1900
· SingleFamily
· Pending
· 113 DOM
Cashflow @ list (25.0% down · 7.5%)
Estimated rent
$1,694/mo
Mortgage (P&I)
−$865
Tax + insurance
−$221
HOA
−$0
Vac / Maint / Mgmt
−$356
Net cashflow
$251/mo
Annual
$3,018/yr
Cap rate
8.12%
Cash-on-cash
6.53%
DSCR
1.29
1% rule
1.03%
Cash to close
$46,200
Investor read
- This is a 3-bed/1.0-bath single-family listed at $165k.
- At list price, monthly cash flow is $251 ($3k/yr) — positive.
- The deal already cash-flows at list — no discount required.
- Meets the 1% rule at list price ($2k rent vs $165k).
- It's been on market 113 days — a 9% lower offer ($150k) is reasonable based on typical stale-listing flexibility.
- Recommended offer: $150k (9.0% below list) — sets the bar for market timing.
- Local home prices are declining (-3.0%/yr); year-one equity from $1k of loan paydown is wiped out by about $5k of value loss. Plan a longer hold.
- Location reads: area grade C — affects rentability + tenant quality, not the cash-flow math above.
- East Pennsboro Area SD (suburban): math 30% / reading 57% proficiency, ranked #275 of 539 in PA (top 51%) — families likely to look elsewhere, expect single-tenant / working-renter base with shorter leases.
- Zoned schools: East Pennsboro Area Shs (math 82% / reading 72%, grade A-, #22 of 437 statewide, top 5%, 761 students, 36% FRL).
- Zoned-school proficiency averages 77% at this address vs 44% district-wide (+34 pts) — the actual schools serving this property are materially stronger than the East Pennsboro Area SD average implies; a family-tenant draw the district grade alone would hide.
- Watch-outs: built in 1900 — expect roof / HVAC / electrical / plumbing capex.
- Market conditions: Rents rising fast (+6.5%/yr); 126 active listings in the ZIP; 5 comparable units currently listed for rent nearby; rentals at typical pace (median 14d on market — plan ~3-4 weeks tenant-placement turnaround); solid renter incomes; 1,052 units permitted in Cumberland County in 2024 (310 in 5+ unit buildings).
- Cumberland County population projected at +17% by 2050 — long-run rental-demand tailwind backs the buy-and-hold thesis.
- 2 sale attempts with the ask held roughly flat each time — persistent listings suggest the price (not the market) is what's stuck; bring a comps-based counter.
- At projected returns (-3.0% appreciation + 6.5% rent growth), your $46k cash investment doubles in ~10 years — after that, you're playing with house money.
- Climate carrying-cost: extreme-heat days projected 7→15/yr by 2055 (HVAC capex compounding) — expect insurance premiums to compound above CPI over the hold.
Questions for listing agent
- It's been on market 113 days. Have you received any prior offers? Is the seller open to a 9% concession, seller financing, or rate buy-down credit?
- Built in 1900 — when were the roof, HVAC, electrical panel, plumbing, and water heater last replaced?
- Why hasn't it sold? Are there any deal-killer items the seller is aware of (foundation, flood, title, zoning, code violations)?
- Is there a deadline driving the sale (1031 exchange, divorce, estate, relocation)? That informs how much negotiation room exists.
- What's the average days-on-market for RENTAL listings here right now (not sales)? A rising rental-DOM trend means longer vacancies and softer asking-rent achievability than the comps imply.
- What's the recent tenant-quality profile in this submarket — average credit score on applications, eviction rate, late-payment / NSF rate, and stable-employment percentage? A property-management company in the area should have these aggregated.
- How much new for-sale + rental construction is in the pipeline within 1–3 miles? Heavy new supply typically softens prices + rents 12–24 months out; constrained supply supports both.
CashFlowRE · CFR-XCWRVG94JD76KW
· Data 2 weeks ago
cashflowre.app · 2026-05-29