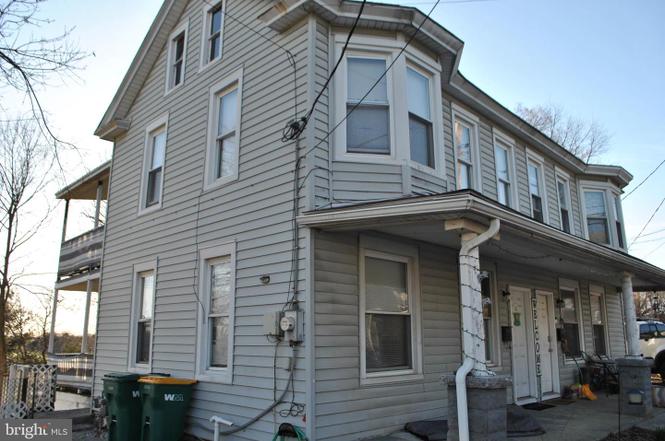
315 S Enola Dr · East Pennsboro, PA
Flood risk 1/10 · Minimal
- FEMA flood zone
- X (unshaded)
- Chance of flooding over 30 yrs
- 0.0%
- Est. flood insurance / yr
- $507 – $1,088
Fire risk 1/10 · Minimal
- Est. fire insurance / yr
- $511 – $949
Heat risk 5/10 · Moderate
- Hot days now (above 101°F)
- 7 days/yr
- Hot days in 30 yrs
- 15 days/yr
Wind risk 2/10 · Minimal
- Chance of severe wind over 30 yrs
- 4.0%
Air-quality risk 2/10 · Minimal
- Unhealthy air days now
- 1 days/yr
- Unhealthy air days in 30 yrs
- 3 days/yr
Risk factors via First Street. Map © Google.
Why this score? — see what drove the C+ grade
The composite is a weighted blend of 9 inputs, each scored 0–100. Each bar is that input's sub-score; the figure is the points it added to the 100-point composite (weight × sub-score).
- Cash flow +21.6/30.0
- ARV discount +15.0/15.0
- DSCR +6.9/10.0
- 1% rule +5.3/10.0
- Rent growth +4.1/5.0
- Schools +3.8/10.0
- Livability +2.5/5.0
- Condition / age +2.5/5.0
- Appreciation +0.0/10.0
$165,000
🖨 Deal sheet 📄 Offer letter ✓ Due diligence
Listing remarks
Great investment property or move in yourself! Home has replacement windows and large kitchen, 3 bedrooms upstairs, nice yard and street parking right outside your door.
Key facts
- Large kitchen
- Nice yard
- Replacement windows
Tags
Property features AI
Exterior
- Parking: On-street parking
- Utilities: Public water; Public sewer; Electric service
- Home design: Semi-detached home; Good property condition; Fee simple ownership
- Construction: Vinyl siding; Shingle and rubber roofing; Stone and concrete perimeter foundation; Building winterized; Above-grade structures
- Exterior features: Not in a federal flood zone; Above-grade finished living space reported
Interior
- Bedrooms: Three bedrooms on the first upper level
- Bathrooms: One full bathroom
- Heating & cooling: Forced air heating (natural gas); Window cooling units (electric); Electric hot water
- Interior features: Basement present (daylight, partial; poured concrete; unfinished); Living area per assessor
- Laundry & utility: Laundry located in the basement
Neighborhood map
What this means for you Summary
Snapshot
- This is a 3-bed/1.0-bath single-family listed at $165k.
Deal economics
- At list price, monthly cash flow is $251 ($3k/yr) — positive.
- The deal already cash-flows at list — no discount required.
- Meets the 1% rule at list price ($2k rent vs $165k).
- Recommended offer: $150k (9.0% below list) — sets the bar for market timing.
Location & tenants
- Location reads: area grade C — affects rentability + tenant quality, not the cash-flow math above.
- East Pennsboro Area SD (suburban): math 30% / reading 57% proficiency, ranked #275 of 539 in PA (top 51%) — families likely to look elsewhere, expect single-tenant / working-renter base with shorter leases.
- Zoned schools: East Pennsboro Area Shs (math 82% / reading 72%, grade A-, #22 of 437 statewide, top 5%, 761 students, 36% FRL).
- Zoned-school proficiency averages 77% at this address vs 44% district-wide (+34 pts) — the actual schools serving this property are materially stronger than the East Pennsboro Area SD average implies; a family-tenant draw the district grade alone would hide.
- Market conditions: Rents rising fast (+6.5%/yr); 126 active listings in the ZIP; 5 comparable units currently listed for rent nearby; rentals leasing fast (median 14d on market — plan ~1-2 weeks tenant-placement turnaround); solid renter incomes; 1,052 units permitted in Cumberland County in 2024 (310 in 5+ unit buildings).
Forward outlook
- Local home prices are declining (-3.0%/yr); year-one equity from $1k of loan paydown is wiped out by about $5k of value loss. Plan a longer hold.
- Cumberland County population projected at +17% by 2050 — long-run rental-demand tailwind backs the buy-and-hold thesis.
- At projected returns (-3.0% appreciation + 6.5% rent growth), your $46k cash investment doubles in ~10 years — after that, you're playing with house money.
Negotiation context
- It's been on market 113 days — a 9% lower offer ($150k) is reasonable based on typical stale-listing flexibility.
- 2 sale attempts with the ask held roughly flat each time — persistent listings suggest the price (not the market) is what's stuck; bring a comps-based counter.
Risks & watch-outs
- Watch-outs: built in 1900 — expect roof / HVAC / electrical / plumbing capex.
- Climate carrying-cost: extreme-heat days projected 7→15/yr by 2055 (HVAC capex compounding) — expect insurance premiums to compound above CPI over the hold.
Questions for the listing agent
- It's been on market 113 days. Have you received any prior offers? Is the seller open to a 9% concession, seller financing, or rate buy-down credit?
- Built in 1900 — when were the roof, HVAC, electrical panel, plumbing, and water heater last replaced?
- Why hasn't it sold? Are there any deal-killer items the seller is aware of (foundation, flood, title, zoning, code violations)?
- Is there a deadline driving the sale (1031 exchange, divorce, estate, relocation)? That informs how much negotiation room exists.
- What's the average days-on-market for RENTAL listings here right now (not sales)? A rising rental-DOM trend means longer vacancies and softer asking-rent achievability than the comps imply.
- What's the recent tenant-quality profile in this submarket — average credit score on applications, eviction rate, late-payment / NSF rate, and stable-employment percentage? A property-management company in the area should have these aggregated.
- How much new for-sale + rental construction is in the pipeline within 1–3 miles? Heavy new supply typically softens prices + rents 12–24 months out; constrained supply supports both.
Investment metrics
- 1% rule
- 1.03% ✓
- Cap rate
- 8.12%
- Cash-on-cash
- 6.53%
- DSCR
- 1.29
- GRM
- 8.1
CMA / ARV
- ARV (on-the-fly)
- $223,776
- Comps found
- 12
Show comp detail 12 sales within ~0.75 mi
| Address | Dist | Beds/Ba | Sqft | Sold | Price | $/sf | Match |
|---|---|---|---|---|---|---|---|
| 25 Creekside Dr | 0.23mi | 3/1.5 | 1,215 (+3%) | 7mo | $275,000 | $226 | 77 |
| 6 E Beale Ave | 0.11mi | 3/2.0 | 1,120 (-5%) | 13mo | $260,000 | $232 | 71 |
| 11 Helen St | 0.26mi | 3/1.0 | 1,204 (+2%) | 17mo | $237,000 | $197 | 71 |
| 301 S Enola Rd | 0.41mi | 3/1.5 | 1,271 (+7%) | 5mo | $156,000 | $123 | 63 |
| 539 W Cumberland Rd | 0.61mi | 3/2.0 | 1,230 (+4%) | 5mo | $270,000 | $220 | 57 |
| 4 Birch St | 0.42mi | 3/2.0 | 1,275 (+8%) | 13mo | $211,550 | $166 | 52 |
| 2 Dulles Dr E | 0.63mi | 3/1.5 | 1,215 (+3%) | 16mo | $210,000 | $173 | 52 |
| 122 Creekside Dr | 0.43mi | 2/1.0 (-1) | 1,056 (-11%) | 10mo | $200,000 | $189 | 49 |
| 418 State St | 0.58mi | 3/1.5 | 1,336 (+13%) | 6mo | $225,000 | $168 | 44 |
| 219 Center St | 0.58mi | 2/1.0 (-1) | 1,056 (-11%) | 9mo | $170,000 | $161 | 43 |
| 1323 5th St | 0.64mi | 2/1.5 (-1) | 1,314 (+11%) | 8mo | $132,000 | $100 | 38 |
| 102 Altoona Ave | 0.75mi | 2/1.0 (-1) | 1,067 (-10%) | 9mo | $202,000 | $189 | 36 |
Match score weights: distance 35% · size 25% · config 20% · recency 20%. Top-matched comps best support the ARV.
Projected returns pro-forma
-3.0% appreciation · 6.46% rent growth · sell at horizon
- IRR
- -2.6%
- Equity multiple
- 0.90×
- Total profit
- $-4,627
- Equity at exit
- $24,602
- IRR
- 10.5%
- Equity multiple
- 1.94×
- Total profit
- $43,449
- Equity at exit
- $14,266
Cash invested: $46,200 (down + closing). Projections, not guarantees.
Landlord ↔ Tenant lean methodology
- Overall (STATE)
- 62 Landlord-Friendly
- State Pennsylvania
- 62 Landlord-Friendly · EVEN
- County
- — inherits STATE
- City
- — inherits STATE
ZIP-level market 17025
- Home prices YoY
- -25.3%
- Rents YoY
- 6.5%
- Active inventory
- 126
- Price-to-rent
- 8.1×
Monthly cashflow live
- Estimated rent
- $1,694 high interval (Pro) →
- Mortgage (P&I)
- −$865
- Tax from tax record
- −$153 /mo · $1,832/yr
- Insurance
- −$69
- HOA
- −$0
- Vacancy / Maint / Mgmt
- −$356
- Net cashflow
- $251
Break-even live
UW: 25.0% down · 7.5% · 30yr · 1.5% tax · 5.0% vac · 8.0% maint · 8.0% mgmt
Financing live
Cash to close
- Down payment
- $41,250
- Closing costs
- $4,950
- Reserves months
- —
- Total cash needed
- —
Loan-product check · same deal, 3 products live
Conventional
25% down · 7.5% · 30yr
- Down + closing
- —
- Monthly P&I
- —
- Monthly cashflow
- —
- DSCR
- —
- Eligible?
- —
Personal DTI + credit; lowest rate.
DSCR
20% down · 8.5% · 30yr
- Down + closing
- —
- Monthly P&I
- —
- Monthly cashflow
- —
- DSCR
- —
- Eligible?
- —
No personal income docs; deal must DSCR.
Hard money
10% down · 12.0% · 12mo
- Down + closing
- —
- Monthly P&I
- —
- Monthly cashflow
- —
- DSCR
- —
- Eligible?
- —
Short-term bridge; refi at stabilization.
Rent comps 5 comps
| Address | Beds | Baths | Sqft | Rent | $/sqft | DOM | Units | Dist |
|---|---|---|---|---|---|---|---|---|
| 7 Adams St Unit 08 Enola, PA | 2.0 | 1.0 | 700 | $1,300 | $1.86 | 23d | 1 | 0.05mi |
| 3 Silk Mill Dr East Pennsboro Township, PA | 2.0 | 1.0–2.0 | 1319 | $1,822 | $1.38 | 13d | 8 | 0.76mi |
| 400 W Crestwood Dr Camp Hill, PA | 1.0–3.0 | 1.0–2.0 | 1042 | $2,071 | $1.99 | 13d | 14 | 1.18mi |
| 64 Queen Ave Enola, PA | 2.0 | 1.5 | 1200 | $1,495 | $1.25 | 13d | 1 | 1.19mi |
| 150 Erford Rd Camp Hill, PA | 1.0–2.0 | 1.5–2.0 | 879 | $1,680 | $1.91 | 13d | 38 | 1.43mi |
Listing history 5 events
-
2026-04-30status Pending
-
2026-01-07$165,000 Active
-
2025-07-07historical
-
2025-04-17$165,000 Active
-
2025-04-10historical
ⓘ Source: listings_history table (triggers on properties + properties_extension) + one-shot
backfill from property_details.listing_events for pre-trigger history.
Tax reassessment forecast PA · Partial reset (capped growth)
- Current annual tax
- $1,832 · $153/mo
- Projected year-2 tax
- $2,220 · $185/mo
- Expected delta
- +$387/yr (+$32/mo · 21.1%)
ⓘ Screening estimate from a state-policy table — verify with the county assessor before closing.
Climate risk First Street
- Flood 1/10 Low FEMA zone X (unshaded) · 0% chance over 30 yrs
- Wildfire 1/10 Low
- Heat 5/10 Major 7 d/yr ≥101°F today · 15 d/yr by 30 yrs out
- Wind 2/10 Low 4% chance of damaging wind over 30 yrs
- Air quality 2/10 Low 1 unhealthy d/yr today · 3 by 30 yrs out
Nearby sold comps map
Loading sold comps map…
Walkable amenities ~0.75 mi
Loading nearby amenities…
Taxation est. · year 1
- Rental income
- $20,327
- − Mortgage interest
- −$9,243
- − Property taxes
- −$1,832
- − Insurance
- −$825
- − Repairs & maintenance
- −$1,626
- − Management
- −$1,626
- − Depreciation
- −$4,800
- Taxable income
- $375
- Est. tax owed @ 24.0%
- −$90
- After-tax cash flow
- $2,928/yr
For passive investors: Depreciation is non-cash, so a rental often shows a tax loss while cash-flowing — sheltering income. Rental losses are passive: they offset passive income freely, and up to $25,000/yr can offset ordinary (W-2) income if you actively participate and your MAGI is under $100k (phasing out to $0 by $150k); unused losses carry forward. On sale, claimed depreciation is recaptured at up to 25%, and gains may owe capital-gains tax (a 1031 exchange can defer both). Figures are a year-1 estimate at your 24.0% rate — not tax advice; consult a CPA.
Schools (NCES district)
- District
- East Pennsboro Area SD
- NCES district ID
- 4208580
- Math proficiency
- 30% ▼ -16.00%
- Reading proficiency
- 57% ▼ -8.00%
- Median HH income
- $60,120
- Composite
- 38.26/100
- National rank
- #4239
- State rank
- #275 of 539 in PA
Livability — East Pennsboro
No livability data for this city. (Only ~50 U.S. cities are tracked.)
Census & demographics
- Census place
- Enola, PA
- County
- Cumberland County · 257,673 people
- Metro
- Harrisburg-Carlisle, PA
- Population (ZIP)
- 17,648
- Household income
- $91,285
- Rent vs Own
- Severe rent burden
- 317.0
Population outlook (Cumberland County) Hauer SSP2
- Today (2025)
- 267,950 people
- By 2030
- 278,105 · +3.8%
- By 2040
- 296,552 · +10.7%
- By 2050
- 312,937 · +16.8%
- By 2075
- 349,233 · +30.3%
- By 2100
- 361,875 · +35.1%
Race, ethnicity, and origin ACS 2023
- Neighborhood character
- Predominantly White (79%)
- Race & ethnicity
- White 79% Hispanic / Latino 6% Asian 6% Two or more races 6% Black 3%
- Hispanic origin (detail)
- Puerto Rican 2% Dominican 2%
- Common ancestry
- Romanian 3% Italian 2% Slovak 2%
- Foreign-born
- 8% · Canada, South Korea, Vietnam
- Languages at home
- 88% English-only · Other Indo-European 5% Spanish 4% Tagalog/Filipino 1%
Political lean MEDSL · Cumberland
- 2024 margin
- Lean R (+9.4) · D 44.6% · R 54.1% · Other 1.3%
- 2008→2024 swing
- +4.2pp toward D · 2008: -13.6pp · 2024: -9.4pp
- All cycles
- 2024: R+9.4 2020: R+10.6 2016: R+18.6 2012: R+18.5 2008: R+13.6
Not yet ingested
- Civics
- —
Market trends
- HPI YoY
- ▼ -85.21%
- Current HPI
- 251.939
- Rent YoY
- ▲ 6.46%
- Metro
- Harrisburg-Carlisle, PA
- State GDP YoY
- ▲ 1.68%
- F500 in state
- 34
Industry mix (Fortune 500 HQ in PA)
| Industry | F500 HQs | Revenue |
|---|---|---|
| Healthcare | 2 | $309B |
|
||
| Insurance | 2 | $27B |
|
||
| Telecommunications / Media | 1 | $124B |
|
||
| Industrial Distribution | 1 | $22B |
|
||
| Financial Services | 1 | $20B |
|
||
| Chemicals / Materials | 1 | $18B |
|
||
Price history
+0.0% since first listed5 events — show timeline
- 2026-04-30 Pending — BRIGHT MLS
- 2026-01-07 Listed $165,000 BRIGHT MLS
- 2025-07-07 Listing Removed — BRIGHT MLS
- 2025-04-17 Listed $165,000 BRIGHT MLS
- 2025-04-10 Coming Soon — BRIGHT MLS
Property tax history
+3.4%/yrLatest (2026): $1,832 · +1.8% YoY. Source: county tax records.
Cash-flow waterfall
monthlySold comps — $/sqft
last 12 mo · ≤1 miLoading sold comps…