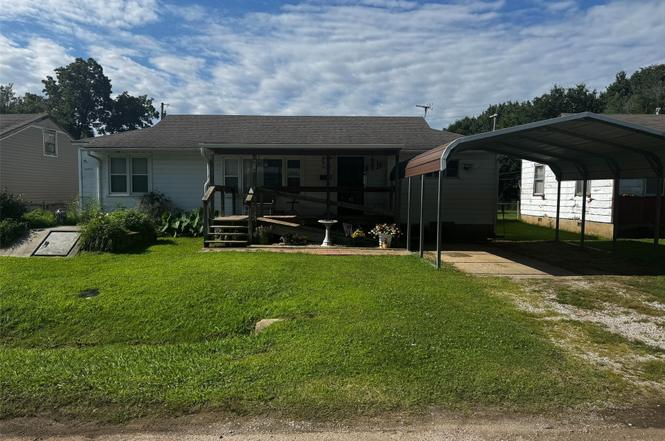
5514 W 3rd St
Tulsa, OK 74127
$129,000B-
3 bd · 1.0 ba ·
1,212 sqft ·
Built 1950
· SingleFamily
· Active
· 1 DOM
Cashflow @ list (25.0% down · 7.5%)
Estimated rent
$1,512/mo
Mortgage (P&I)
−$676
Tax + insurance
−$524
HOA
−$0
Vac / Maint / Mgmt
−$317
Net cashflow
$-6/mo
Annual
$-68/yr
Cap rate
10.21%
Cash-on-cash
13.98%
DSCR
1.62
1% rule
1.17%
Cash to close
$36,120
Investor read
- This is a 3-bed/1.0-bath single-family listed at $129k.
- At list price, monthly cash flow is $-6 ($-68/yr) — negative.
- To cash-flow at today's rent, offer at most $128k (0.8% below list).
- Meets the 1% rule at list price ($2k rent vs $129k).
- Only 1 days on market — expect competitive offers; lowballing is unlikely to land.
- Recommended offer: $128k (0.8% below list) — sets the bar for cash-flow.
- Local home prices are declining (-3.0%/yr); year-one equity from $892 of loan paydown is wiped out by about $4k of value loss. Plan a longer hold.
- Location reads 75/100 on livability (#13 in OK, #4,058 nationally) — a middle-class / working-renter tenant base. Strengths: amenities A+, commute A+, cost of living A+; Watch: schools F, crime F, employment D-.
- Tulsa (urban): math 7% / reading 12% proficiency, ranked #250 of 270 in OK (top 93%) — low school quality limits family demand, transient renter base, plan for 1-2y turnover; 76% free/reduced lunch — lower-income household profile, screen leases tightly.
- Watch-outs: flood insurance adds $427/mo; built in 1950 — expect roof / HVAC / electrical / plumbing capex.
- Market conditions: Rents rising (+2.5%/yr); 113 active listings in the ZIP; 2 comparable units currently listed for rent nearby; 2,818 units permitted in Tulsa County in 2024 (518 in 5+ unit buildings).
- Tulsa County population projected at +30% by 2050 — long-run rental-demand tailwind backs the buy-and-hold thesis.
- Climate carrying-cost: in FEMA flood zone AE (mandatory federal flood insurance); moderate wildfire risk; extreme-heat days projected 7→18/yr by 2055 (HVAC capex compounding) — expect insurance premiums to compound above CPI over the hold.
- Cap rate 10.2% vs local median 3.9% in Tulsa — top-decile yield for the area; either an underpriced asset or a hidden risk that comps aren't pricing in. Stress-test before assuming the spread holds.
- This rent runs 39% of the median local income ($46k/yr) — at the standard rent-burdened threshold; future hikes will face affordability resistance.
Questions for listing agent
- What do current leases actually rent for vs. the listed asking? Can we see a recent rent roll and the last 12 months of T-12 income?
- Built in 1950 — when were the roof, HVAC, electrical panel, plumbing, and water heater last replaced?
- What's the actual annual flood-insurance premium (NFIP or private), and is the property in a SFHA with mandatory coverage?
- Is there a deadline driving the sale (1031 exchange, divorce, estate, relocation)? That informs how much negotiation room exists.
- Schools are F-rated, which usually means shorter tenancies and higher turnover. Who's the typical renter profile here, and what's been the actual vacancy rate?
- Crime grade is F in this area — have there been break-ins, vandalism, or insurance claims at this property in the last 3 years? What carrier currently insures it and at what premium?
- What's the average days-on-market for RENTAL listings here right now (not sales)? A rising rental-DOM trend means longer vacancies and softer asking-rent achievability than the comps imply.
- What's the recent tenant-quality profile in this submarket — average credit score on applications, eviction rate, late-payment / NSF rate, and stable-employment percentage? A property-management company in the area should have these aggregated.
CashFlowRE · CFR-XEN05WAH77PVHR
· Data 1 day ago
cashflowre.app · 2026-05-29