5514 W 3rd St · Tulsa, OK
Flood risk 7/10 · Major
- FEMA flood zone
- AE
- Chance of flooding over 30 yrs
- 0.76%
- Est. flood insurance / yr
- $1,737 – $8,500
Fire risk 5/10 · Moderate
- Est. fire insurance / yr
- $2,463 – $4,575
Heat risk 6/10 · Moderate
- Hot days now (above 110°F)
- 7 days/yr
- Hot days in 30 yrs
- 18 days/yr
Wind risk 3/10 · Minor
- Chance of severe wind over 30 yrs
- 5.0%
Air-quality risk 2/10 · Minimal
- Unhealthy air days now
- 2 days/yr
- Unhealthy air days in 30 yrs
- 2 days/yr
Risk factors via First Street. Map © Google.
Why this score? — see what drove the B- grade
The composite is a weighted blend of 9 inputs, each scored 0–100. Each bar is that input's sub-score; the figure is the points it added to the 100-point composite (weight × sub-score).
- Cash flow +28.5/30.0
- ARV discount +12.3/15.0
- DSCR +10.0/10.0
- 1% rule +6.7/10.0
- Livability +3.8/5.0
- Rent growth +3.1/5.0
- Condition / age +2.5/5.0
- Schools +0.8/10.0
- Appreciation +0.0/10.0
$129,000
🖨 Deal sheet 📄 Offer letter ✓ Due diligence
Listing remarks
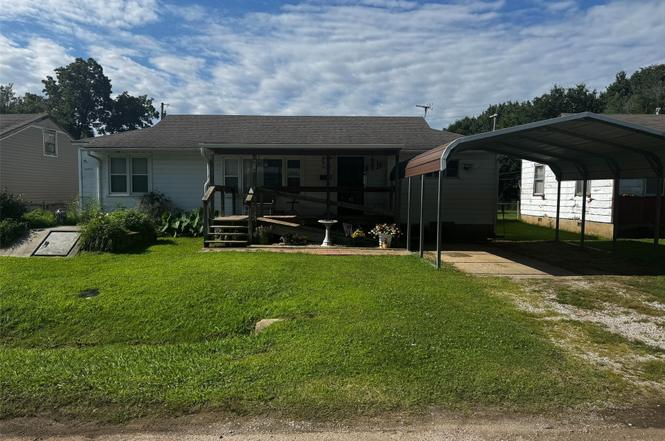
Opportunity awaits with this 3-bedroom, 1.5-bath home situated on approximately * * 0.38 acres * * in a convenient location between * * Sand Springs and downtown Tulsa * * , offering easy access to major highways and the turnpike for a quick commute. The property features several * * Window World replacement windows with a transferable warranty * * , providing added value and peace of mind. Accessibility is enhanced with an existing ramp, and the spacious lot includes exceptional storage options with a * * large storage building equipped with electricity * * , an additional storage shed, and * * two shipping containers * * , all of which will remain with the property
Key facts
- Existing ramp
- Convenient location
- 0.38 acre lot
Tags
Property features AI
Exterior
- Parking: 2-car garage; Carport
- Security: Storm shelter; Smoke detector(s)
- Utilities: Electricity available; Natural gas available; Public water; Septic tank sewer
- Home design: Single-story; North-facing; Crawlspace foundation
- Construction: Wood siding with wood frame construction; Asphalt/fiberglass roof; Built (year per public records)
- Exterior features: Concrete driveway; Enclosed porch; Porch; Shed(s) / storage; Chain link fencing; Storm shelter
Interior
- Kitchen: Eat-in kitchen; Oven, Range, Stove; Dishwasher; Refrigerator
- Bedrooms: Total of 3 rooms (includes bedrooms and other rooms)
- Flooring: Carpet; Laminate
- Bathrooms: One full bathroom; One half bathroom; Hall bath with shower
- Heating & cooling: Central heating (gas); Central air conditioning
- Interior features: Vinyl and wood frame windows; Laminate counters; Gas range and gas oven connections; Smoke detector(s)
- Laundry & utility: Washer and dryer included; Washer hookup; Gas dryer hookup; Utility room (inside)
Neighborhood map
What this means for you Summary
Snapshot
- This is a 3-bed/1.0-bath single-family listed at $129k.
Deal economics
- At list price, monthly cash flow is $-6 ($-68/yr) — negative.
- To cash-flow at today's rent, offer at most $128k (0.8% below list).
- Meets the 1% rule at list price ($2k rent vs $129k).
- Recommended offer: $128k (0.8% below list) — sets the bar for cash-flow.
- Cap rate 10.2% vs local median 3.9% in Tulsa — top-decile yield for the area; either an underpriced asset or a hidden risk that comps aren't pricing in. Stress-test before assuming the spread holds.
Location & tenants
- Location reads 75/100 on livability (#13 in OK, #4,058 nationally) — a middle-class / working-renter tenant base. Strengths: amenities A+, commute A+, cost of living A+; Watch: schools F, crime F, employment D-.
- Tulsa (urban): math 7% / reading 12% proficiency, ranked #250 of 270 in OK (top 93%) — low school quality limits family demand, transient renter base, plan for 1-2y turnover; 76% free/reduced lunch — lower-income household profile, screen leases tightly.
- Market conditions: Rents rising (+2.5%/yr); 113 active listings in the ZIP; 2 comparable units currently listed for rent nearby; 2,818 units permitted in Tulsa County in 2024 (518 in 5+ unit buildings).
- This rent runs 39% of the median local income ($46k/yr) — at the standard rent-burdened threshold; future hikes will face affordability resistance.
Forward outlook
- Local home prices are declining (-3.0%/yr); year-one equity from $892 of loan paydown is wiped out by about $4k of value loss. Plan a longer hold.
- Tulsa County population projected at +30% by 2050 — long-run rental-demand tailwind backs the buy-and-hold thesis.
Negotiation context
- Only 1 days on market — expect competitive offers; lowballing is unlikely to land.
Risks & watch-outs
- Watch-outs: flood insurance adds $427/mo; built in 1950 — expect roof / HVAC / electrical / plumbing capex.
- Climate carrying-cost: in FEMA flood zone AE (mandatory federal flood insurance); moderate wildfire risk; extreme-heat days projected 7→18/yr by 2055 (HVAC capex compounding) — expect insurance premiums to compound above CPI over the hold.
Questions for the listing agent
- What do current leases actually rent for vs. the listed asking? Can we see a recent rent roll and the last 12 months of T-12 income?
- Built in 1950 — when were the roof, HVAC, electrical panel, plumbing, and water heater last replaced?
- What's the actual annual flood-insurance premium (NFIP or private), and is the property in a SFHA with mandatory coverage?
- Is there a deadline driving the sale (1031 exchange, divorce, estate, relocation)? That informs how much negotiation room exists.
- Schools are F-rated, which usually means shorter tenancies and higher turnover. Who's the typical renter profile here, and what's been the actual vacancy rate?
- Crime grade is F in this area — have there been break-ins, vandalism, or insurance claims at this property in the last 3 years? What carrier currently insures it and at what premium?
- What's the average days-on-market for RENTAL listings here right now (not sales)? A rising rental-DOM trend means longer vacancies and softer asking-rent achievability than the comps imply.
- What's the recent tenant-quality profile in this submarket — average credit score on applications, eviction rate, late-payment / NSF rate, and stable-employment percentage? A property-management company in the area should have these aggregated.
- How much new for-sale + rental construction is in the pipeline within 1–3 miles? Heavy new supply typically softens prices + rents 12–24 months out; constrained supply supports both.
Investment metrics
- 1% rule
- 1.17% ✓
- Cap rate
- 10.21%
- Cash-on-cash
- 13.98%
- DSCR
- 1.62
- GRM
- 7.1
CMA / ARV
- ARV (on-the-fly)
- $144,228
- Comps found
- 12
Show comp detail 12 sales within ~0.75 mi
| Address | Dist | Beds/Ba | Sqft | Sold | Price | $/sf | Match |
|---|---|---|---|---|---|---|---|
| 5330 W 2nd St | 0.11mi | 3/2.0 | 1,212 (0%) | 7mo | $90,000 | $74 | 85 |
| 4933 W 2nd St | 0.19mi | 2/1.0 (-1) | 1,224 (+1%) | 8mo | $47,500 | $39 | 78 |
| 444 S 43rd WestAvenue | 0.64mi | 3/1.0 | 1,212 (0%) | 0mo | $95,000 | $78 | 70 |
| 4920 Charles Page Blvd | 0.41mi | 3/1.0 | 1,092 (-10%) | 1mo | $142,400 | $130 | 64 |
| 429 S 49th WestAvenue | 0.31mi | 3/1.0 | 1,050 (-13%) | 1mo | $155,000 | $148 | 62 |
| 4330 W Archer St | 0.57mi | 3/1.0 | 1,164 (-4%) | 6mo | $155,900 | $134 | 62 |
| 5677 W 3rd St | 0.19mi | 2/1.0 (-1) | 1,072 (-12%) | 8mo | $95,500 | $89 | 60 |
| 5112 W 10th St | 0.52mi | 2/1.5 (-1) | 1,160 (-4%) | 8mo | $163,900 | $141 | 55 |
| 5340 W 11th St | 0.59mi | 4/2.0 (+1) | 1,250 (+3%) | 4mo | $148,000 | $118 | 55 |
| 4716 W 8th St | 0.55mi | 4/2.0 (+1) | 1,292 (+7%) | 1mo | $158,000 | $122 | 53 |
| 224 N 43rd Ave | 0.69mi | 2/1.0 (-1) | 1,391 (+15%) | 6mo | $115,000 | $83 | 33 |
| 344 S 41st WestAvenue | 0.74mi | 4/1.5 (+1) | 1,383 (+14%) | 6mo | $165,000 | $119 | 30 |
Match score weights: distance 35% · size 25% · config 20% · recency 20%. Top-matched comps best support the ARV.
Projected returns pro-forma
-3.0% appreciation · 2.45% rent growth · sell at horizon
- IRR
- -17.2%
- Equity multiple
- 0.39×
- Total profit
- $-21,884
- Equity at exit
- $19,234
- IRR
- -10.3%
- Equity multiple
- 0.39×
- Total profit
- $-22,035
- Equity at exit
- $11,154
Cash invested: $36,120 (down + closing). Projections, not guarantees.
Landlord ↔ Tenant lean methodology
- Overall (STATE)
- 83 Strongly Landlord-Friendly
- State Oklahoma
- 83 Strongly Landlord-Friendly · R+20
- County
- — inherits STATE
- City
- — inherits STATE
ZIP-level market 74127
- Home prices YoY
- -20.4%
- Rents YoY
- 2.5%
- Active inventory
- 113
- Price-to-rent
- 7.1×
Monthly cashflow live
- Estimated rent
- $1,512 medium interval (Pro) →
- Mortgage (P&I)
- −$676
- Tax from tax record
- −$43 /mo · $519/yr
- Insurance
- −$54
- Flood insurance flood zone
- −$427 /mo · $5,118/yr
- HOA
- −$0
- Vacancy / Maint / Mgmt
- −$317
- Net cashflow
- $-6
Break-even live
UW: 25.0% down · 7.5% · 30yr · 1.5% tax · 5.0% vac · 8.0% maint · 8.0% mgmt
Financing live
Cash to close
- Down payment
- $32,250
- Closing costs
- $3,870
- Reserves months
- —
- Total cash needed
- —
Loan-product check · same deal, 3 products live
Conventional
25% down · 7.5% · 30yr
- Down + closing
- —
- Monthly P&I
- —
- Monthly cashflow
- —
- DSCR
- —
- Eligible?
- —
Personal DTI + credit; lowest rate.
DSCR
20% down · 8.5% · 30yr
- Down + closing
- —
- Monthly P&I
- —
- Monthly cashflow
- —
- DSCR
- —
- Eligible?
- —
No personal income docs; deal must DSCR.
Hard money
10% down · 12.0% · 12mo
- Down + closing
- —
- Monthly P&I
- —
- Monthly cashflow
- —
- DSCR
- —
- Eligible?
- —
Short-term bridge; refi at stabilization.
Rent comps 2 comps
| Address | Beds | Baths | Sqft | Rent | $/sqft | DOM | Units | Dist |
|---|---|---|---|---|---|---|---|---|
| 5330 W 2nd St Tulsa, OK | 4.0 | 2.0 | 1212 | $1,700 | $1.40 | 1d | 1 | 0.09mi |
| 5913 W 8th St Tulsa, OK | 2.0 | 1.0 | 820 | $1,050 | $1.28 | 21d | 1 | 0.56mi |
Listing history 2 events
-
2026-06-19remarks 694-char remark
-
2026-06-19$129,000 Active 1 DOM
ⓘ Source: listings_history table (triggers on properties + properties_extension) + one-shot
backfill from property_details.listing_events for pre-trigger history.
Tax reassessment forecast OK · Resets to sale price
- Current annual tax
- $519 · $43/mo
- Projected year-2 tax
- $1,161 · $97/mo
- Expected delta
- +$642/yr (+$54/mo · 123.7%)
ⓘ Screening estimate from a state-policy table — verify with the county assessor before closing.
Climate risk First Street
- Flood 7/10 Severe FEMA zone AE · 76% chance over 30 yrs
- Wildfire 5/10 Major
- Heat 6/10 Major 7 d/yr ≥110°F today · 18 d/yr by 30 yrs out
- Wind 3/10 Moderate 5% chance of damaging wind over 30 yrs
- Air quality 2/10 Low 2 unhealthy d/yr today · 2 by 30 yrs out
Nearby sold comps map
Loading sold comps map…
Walkable amenities ~0.75 mi
Loading nearby amenities…
Taxation est. · year 1
- Rental income
- $18,142
- − Mortgage interest
- −$7,226
- − Property taxes
- −$519
- − Insurance
- −$5,764
- − Repairs & maintenance
- −$1,451
- − Management
- −$1,451
- − Depreciation
- −$3,753
- Taxable loss
- −$2,022
- Est. tax savings @ 24.0%
- +$485
- After-tax cash flow
- $417/yr
For passive investors: Depreciation is non-cash, so a rental often shows a tax loss while cash-flowing — sheltering income. Rental losses are passive: they offset passive income freely, and up to $25,000/yr can offset ordinary (W-2) income if you actively participate and your MAGI is under $100k (phasing out to $0 by $150k); unused losses carry forward. On sale, claimed depreciation is recaptured at up to 25%, and gains may owe capital-gains tax (a 1031 exchange can defer both). Figures are a year-1 estimate at your 24.0% rate — not tax advice; consult a CPA.
Schools (NCES district)
- District
- Tulsa
- NCES district ID
- 4030240
- Math proficiency
- 7% ▼ -9.00%
- Reading proficiency
- 12% ▼ -7.00%
- Median HH income
- $37,895
- Composite
- 8.04/100
- National rank
- #9919
- State rank
- #250 of 270 in OK
Livability — Tulsa
- Score
- 75/100
- State rank
- #13
- US rank
- #4058
Category grades
Schools grade is shown separately in the Schools card above.
Census & demographics
- County
- Osage County · 26,244 people
- City population
- 389,418
- Metro
- Tulsa, OK
- Population (ZIP)
- 16,324
- Household income
- $46,373
- Rent vs Own
- Severe rent burden
- 782.0
Population outlook (Tulsa County) Hauer SSP2
- Today (2025)
- 723,846 people
- By 2030
- 766,033 · +5.8%
- By 2040
- 851,386 · +17.6%
- By 2050
- 938,389 · +29.6%
- By 2075
- 1,166,011 · +61.1%
- By 2100
- 1,350,277 · +86.5%
Race, ethnicity, and origin ACS 2023
- Neighborhood character
- Diverse neighborhood (Simpson 0.66)
- Race & ethnicity
- White 50% Black 28% Two or more races 10% Hispanic / Latino 7% Native American 7%
- Hispanic origin (detail)
- Mexican 5%
- Common ancestry
- Slovak 2% Italian 1% Iranian 1%
- Foreign-born
- 4% · Canada, Jamaica
- Languages at home
- 94% English-only · Spanish 4%
Political lean MEDSL · Tulsa
- 2024 margin
- R (+15.2) · D 41.3% · R 56.5% · Other 2.2%
- 2008→2024 swing
- +9.2pp toward D · 2008: -24.5pp · 2024: -15.2pp
- All cycles
- 2024: R+15.2 2020: R+15.6 2016: R+22.9 2012: R+27.4 2008: R+24.5
Not yet ingested
- Civics
- —
Market trends
- HPI YoY
- ▼ -59.31%
- Current HPI
- 231.5994
- Rent YoY
- ▲ 2.45%
- Metro
- Tulsa, OK
- State GDP YoY
- ▲ 1.55%
- F500 in state
- 6
Industry mix (Fortune 500 HQ in OK)
| Industry | F500 HQs | Revenue |
|---|---|---|
| Energy | 3 | $48B |
|
||
Price history
1 event — show timeline
- 2026-06-15 Listed $129,000 MLS Technology, Inc.
Property tax history
+3.6%/yrLatest (2025): $519 · +0.6% YoY. Source: county tax records.
Cash-flow waterfall
monthlySold comps — $/sqft
last 12 mo · ≤1 miLoading sold comps…