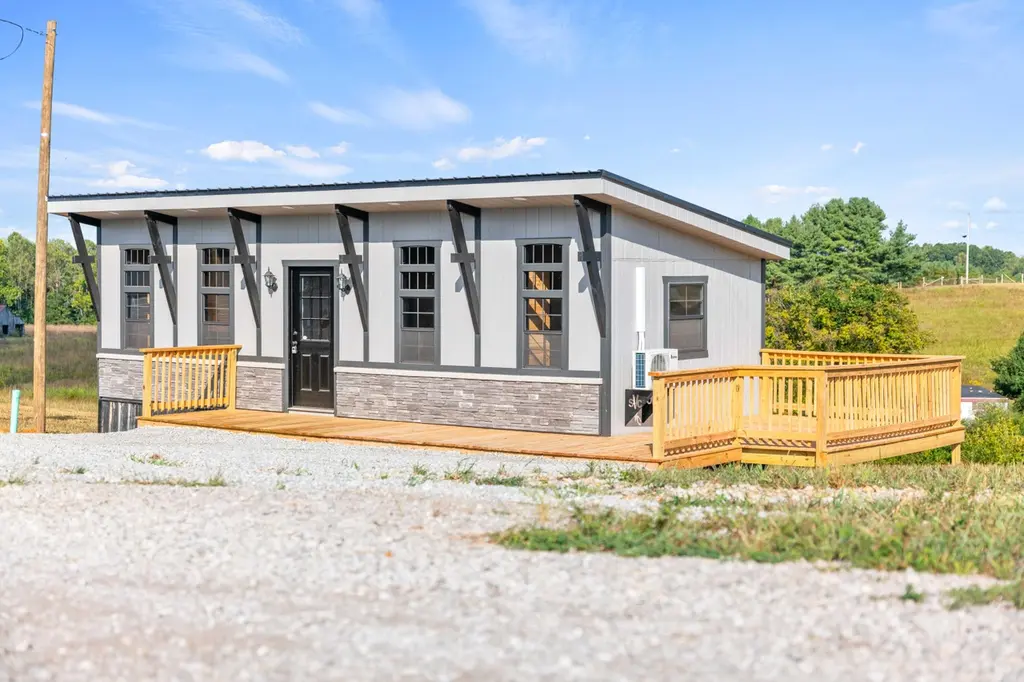
126 Spring Branch Hollow Rd
Monticello, KY 42544
$95,000C
1 bd · 1.0 ba ·
439 sqft ·
Built 2025
· SingleFamily
· Active
· 25 DOM
Cashflow @ list (25.0% down · 7.5%)
Estimated rent
$989/mo
Mortgage (P&I)
−$498
Tax + insurance
−$158
HOA
−$0
Vac / Maint / Mgmt
−$208
Net cashflow
$125/mo
Annual
$1,500/yr
Cap rate
7.87%
Cash-on-cash
5.64%
DSCR
1.25
1% rule
1.04%
Cash to close
$26,600
Investor read
- This is a 1-bed/1.0-bath single-family listed at $95k. Condition is rated excellent.
- At list price, monthly cash flow is $125 ($2k/yr) — positive.
- The deal already cash-flows at list — no discount required.
- Meets the 1% rule at list price ($989 rent vs $95k).
- It's been on market 25 days — a 2% lower offer ($94k) is reasonable based on typical stale-listing flexibility.
- Recommended offer: $94k (1.5% below list) — sets the bar for market timing.
- In year one you build about $605 of equity ($657 loan paydown + $-52 appreciation (-0.1% local appreciation)).
- Location reads 65/100 on livability (#265 in KY) — a middle-class / working-renter tenant base. Strengths: crime A+, cost of living A+, housing A+; Watch: amenities F, commute F, employment F.
- Wayne County (town): math 20% / reading 33% proficiency, ranked #142 of 165 in KY (top 86%) — low school quality limits family demand, transient renter base, plan for 1-2y turnover.
- Zoned schools: Monticello Elementary School (math 21% / reading 28%, grade F, #489 of 676 statewide, top 76%, 630 students, 79% FRL); Wayne County Middle School (math 18% / reading 36%, grade F, #172 of 217 statewide, top 80%, 679 students, 75% FRL); Wayne County High School (math 24% / reading 40%, grade F, #97 of 254 statewide, top 46%, 940 students, 76% FRL) — zoned schools average 77% FRL vs 57% district-wide (19 pts higher); higher-poverty schools than district average — tighter screening recommended.
- Market conditions: 172 active listings in the ZIP.
- Wayne County population projected at -20% by 2050 — secular population decline; favor cash flow + early exit over multi-decade hold.
- 2 sale attempts with the ask held roughly flat each time — persistent listings suggest the price (not the market) is what's stuck; bring a comps-based counter.
- At projected returns (-0.1% appreciation + 3.0% rent growth), your $27k cash investment doubles in ~9 years — after that, you're playing with house money.
- Cap rate 7.9% vs local median 3.6% in Monticello — top-decile yield for the area; either an underpriced asset or a hidden risk that comps aren't pricing in. Stress-test before assuming the spread holds.
Questions for listing agent
- Is there a deadline driving the sale (1031 exchange, divorce, estate, relocation)? That informs how much negotiation room exists.
- Schools are F-rated, which usually means shorter tenancies and higher turnover. Who's the typical renter profile here, and what's been the actual vacancy rate?
- What's the average days-on-market for RENTAL listings here right now (not sales)? A rising rental-DOM trend means longer vacancies and softer asking-rent achievability than the comps imply.
- What's the recent tenant-quality profile in this submarket — average credit score on applications, eviction rate, late-payment / NSF rate, and stable-employment percentage? A property-management company in the area should have these aggregated.
- How much new for-sale + rental construction is in the pipeline within 1–3 miles? Heavy new supply typically softens prices + rents 12–24 months out; constrained supply supports both.
CashFlowRE · CFR-XEP3JEAJAGQTJR
· Data 9 h ago
cashflowre.app · 2026-05-29