 🏗️ New Construction
126 Spring Branch Hollow Rd · Monticello, KY
Flood risk No data
- FEMA flood zone
- —
- Chance of flooding over 30 yrs
- —
- Est. flood insurance / yr
- —
Fire risk No data
- Est. fire insurance / yr
- —
Heat risk No data
- Hot days now (above threshold)
- —
- Hot days in 30 yrs
- —
Wind risk No data
- Chance of severe wind over 30 yrs
- —
Air-quality risk No data
- Unhealthy air days now
- —
- Unhealthy air days in 30 yrs
- —
Risk factors via First Street. Map © Google.
Why this score? — see what drove the C grade
The composite is a weighted blend of 9 inputs, each scored 0–100. Each bar is that input's sub-score; the figure is the points it added to the 100-point composite (weight × sub-score).
- Cash flow +20.5/30.0
- ARV discount +7.5/15.0
- DSCR +6.5/10.0
- 1% rule +5.4/10.0
- Appreciation +5.0/10.0
- Condition / age +4.8/5.0
- Livability +3.2/5.0
- Rent growth +2.5/5.0
- Schools +2.1/10.0
$95,000
🖨 Deal sheet (PDF) 📄 Offer letter ✓ Due diligence
Listing remarks
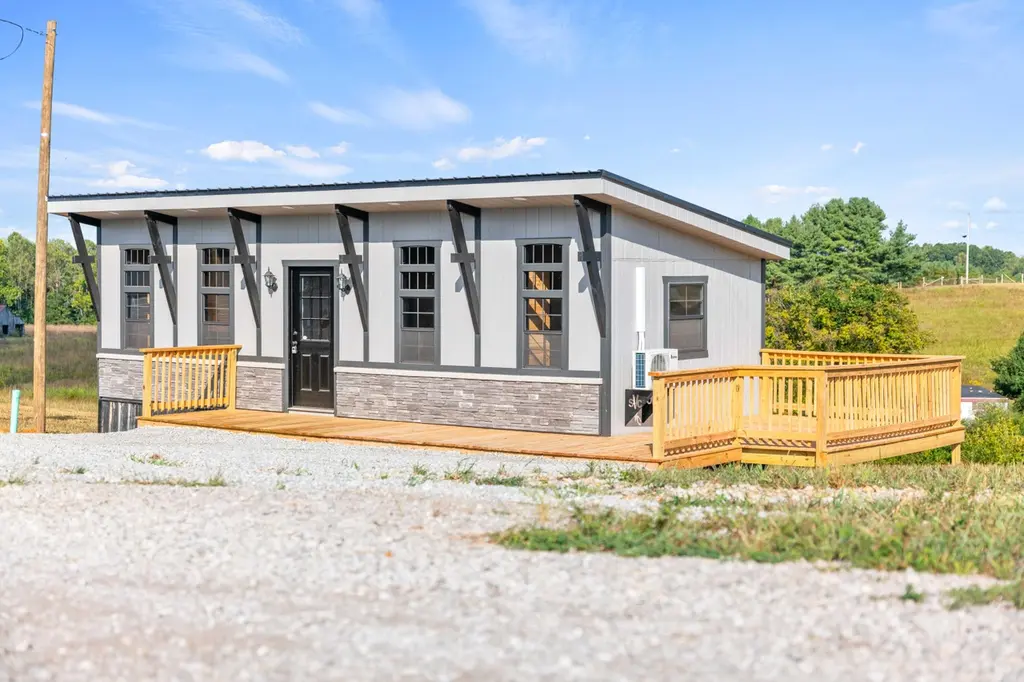
Searching for a peaceful tiny home retreat near Lake Cumberland? This brand new 439 square foot tiny home on a 1-acre lot in Nancy, Kentucky offers the perfect blend of rural living and modern convenience. Whether you're looking for a weekend lake getaway, a full-time minimalist lifestyle, or an investment opportunity, this property checks all the boxes. The home features attractive wood and stone siding, a durable metal roof, warm wood-finished interior walls, and a mini-split HVAC system to keep you comfortable year-round. Inside you'll find a functional layout complete with a designated bedroom, full bathroom, stove top, microwave, and refrigerator coming soon. Thoughtfully designed to m
Key facts
- Metal roof
- Full bathroom
- 1 acre lot
Tags
Neighborhood map
What this means for you Summary
Snapshot
- This is a 1-bed/1.0-bath single-family listed at $95k. Condition is rated excellent.
Deal economics
- At list price, monthly cash flow is $125 ($2k/yr) — positive.
- The deal already cash-flows at list — no discount required.
- Meets the 1% rule at list price ($989 rent vs $95k).
- Recommended offer: $94k (1.5% below list) — sets the bar for market timing.
- Cap rate 7.9% vs local median 3.9% in Monticello — top-decile yield for the area; either an underpriced asset or a hidden risk that comps aren't pricing in. Stress-test before assuming the spread holds.
Location & tenants
- Location reads 65/100 on livability (#265 in KY) — a middle-class / working-renter tenant base. Strengths: crime A+, cost of living A+, housing A+; Watch: schools F, amenities F, commute F.
- Wayne County (town): math 20% / reading 33% proficiency, ranked #142 of 165 in KY (top 86%) — low school quality limits family demand, transient renter base, plan for 1-2y turnover.
- Market conditions: 172 active listings in the ZIP.
Forward outlook
- In year one you build about $605 of equity ($657 loan paydown + $-52 appreciation (-0.1% local appreciation)).
- Wayne County population projected at -20% by 2050 — secular population decline; favor cash flow + early exit over multi-decade hold.
- At projected returns (-0.1% appreciation + 3.0% rent growth), your $27k cash investment doubles in ~9 years — after that, you're playing with house money.
Negotiation context
- It's been on market 25 days — a 2% lower offer ($94k) is reasonable based on typical stale-listing flexibility.
- 2 sale attempts with the ask held roughly flat each time — persistent listings suggest the price (not the market) is what's stuck; bring a comps-based counter.
Questions for the listing agent
- Is there a deadline driving the sale (1031 exchange, divorce, estate, relocation)? That informs how much negotiation room exists.
- Schools are F-rated, which usually means shorter tenancies and higher turnover. Who's the typical renter profile here, and what's been the actual vacancy rate?
- What's the average days-on-market for RENTAL listings here right now (not sales)? A rising rental-DOM trend means longer vacancies and softer asking-rent achievability than the comps imply.
- What's the recent tenant-quality profile in this submarket — average credit score on applications, eviction rate, late-payment / NSF rate, and stable-employment percentage? A property-management company in the area should have these aggregated.
- How much new for-sale + rental construction is in the pipeline within 1–3 miles? Heavy new supply typically softens prices + rents 12–24 months out; constrained supply supports both.
Investment metrics
- 1% rule
- 1.04% ✓
- Cap rate
- 7.87%
- Cash-on-cash
- 5.64%
- DSCR
- 1.25
- GRM
- 8.0
CMA / ARV
No comps found within radius.
Projected returns pro-forma
-0.05% appreciation · 3.0% rent growth · sell at horizon
- IRR
- 3.9%
- Equity multiple
- 1.19×
- Total profit
- $4,952
- Equity at exit
- $27,327
- IRR
- 9.3%
- Equity multiple
- 2.01×
- Total profit
- $26,812
- Equity at exit
- $32,644
Cash invested: $26,600 (down + closing). Projections, not guarantees.
Landlord ↔ Tenant lean methodology
- Overall (STATE)
- 83 Strongly Landlord-Friendly
- State Kentucky
- 83 Strongly Landlord-Friendly · R+16
- County
- — inherits STATE
- City
- — inherits STATE
ZIP-level market 42544
- Home prices YoY
- -0.0%
- Active inventory
- 172
- Price-to-rent
- 8.0×
Monthly cashflow live
- Estimated rent
- $989 medium interval (Pro) →
- Mortgage (P&I)
- −$498
- Tax est. 1.5%
- −$119 /mo · $1,425/yr
- Insurance
- −$40
- HOA
- −$0
- Vacancy / Maint / Mgmt
- −$208
- Net cashflow
- $125
Break-even live
Sensitivity live
| Price | -10% $191 | -5% $158 | +0% $125 | +5% $92 | +10% $59 |
|---|---|---|---|---|---|
| Rent | -10% $47 | -5% $86 | +0% $125 | +5% $164 | +10% $203 |
| Rate | -1.0pp $173 | -0.5pp $149 | base $125 | +0.5pp $100 | +1.0pp $75 |
UW: 25.0% down · 7.5% · 30yr · 1.5% tax · 5.0% vac · 8.0% maint · 8.0% mgmt
Financing live
Cash to close
- Down payment
- $23,750
- Closing costs
- $2,850
- Reserves months
- —
- Total cash needed
- —
Loan-product check · same deal, 3 products live
Conventional
25% down · 7.5% · 30yr
- Down + closing
- —
- Monthly P&I
- —
- Monthly cashflow
- —
- DSCR
- —
- Eligible?
- —
Personal DTI + credit; lowest rate.
DSCR
20% down · 8.5% · 30yr
- Down + closing
- —
- Monthly P&I
- —
- Monthly cashflow
- —
- DSCR
- —
- Eligible?
- —
No personal income docs; deal must DSCR.
Hard money
10% down · 12.0% · 12mo
- Down + closing
- —
- Monthly P&I
- —
- Monthly cashflow
- —
- DSCR
- —
- Eligible?
- —
Short-term bridge; refi at stabilization.
Listing history 31 events
-
2026-06-21days on market $95,000 Active 25 DOM
-
2026-06-21days on market $95,000 Active 24 DOM
-
2026-06-18days on market $95,000 Active 22 DOM
-
2026-06-17days on market $95,000 Active 21 DOM
-
2026-06-16days on market $95,000 Active 20 DOM
-
2026-06-15days on market $95,000 Active 19 DOM
-
2026-06-13days on market $95,000 Active 17 DOM
-
2026-06-12days on market $95,000 Active 16 DOM
-
2026-06-09days on market $95,000 Active 13 DOM
-
2026-06-08days on market $95,000 Active 12 DOM
-
2026-06-07days on market $95,000 Active 11 DOM
-
2026-06-05days on market $95,000 Active 9 DOM
-
2026-06-04days on market $95,000 Active 7 DOM
-
2026-06-02days on market $95,000 Active 6 DOM
-
2026-06-01days on market $95,000 Active 5 DOM
-
2026-05-31days on market $95,000 Active 4 DOM
-
2026-05-31days on market $95,000 Active 3 DOM
-
2026-04-18status Pending
-
2026-03-27price $94,900
-
2026-03-18price $97,000
-
2026-03-06price $97,900
-
2026-02-24status Active
-
2026-02-18historical Contingent
-
2026-01-23price $99,000
-
2026-01-07price $100,000
-
2025-12-03price $97,400
-
2025-10-31price $97,900
-
2025-10-21price $98,900
-
2025-10-08price $99,400
-
2025-09-29price $99,500
-
2025-09-05$99,900 Active
ⓘ Source: listings_history table (triggers on properties + properties_extension) + one-shot
backfill from property_details.listing_events for pre-trigger history.
Nearby sold comps map
Loading sold comps map…
Walkable amenities ~0.75 mi
Loading nearby amenities…
Taxation est. · year 1
- Rental income
- $11,871
- − Mortgage interest
- −$5,321
- − Property taxes
- −$1,425
- − Insurance
- −$475
- − Repairs & maintenance
- −$950
- − Management
- −$950
- − Depreciation
- −$2,764
- Taxable loss
- −$14
- Est. tax savings @ 24.0%
- +$3
- After-tax cash flow
- $1,503/yr
For passive investors: Depreciation is non-cash, so a rental often shows a tax loss while cash-flowing — sheltering income. Rental losses are passive: they offset passive income freely, and up to $25,000/yr can offset ordinary (W-2) income if you actively participate and your MAGI is under $100k (phasing out to $0 by $150k); unused losses carry forward. On sale, claimed depreciation is recaptured at up to 25%, and gains may owe capital-gains tax (a 1031 exchange can defer both). Figures are a year-1 estimate at your 24.0% rate — not tax advice; consult a CPA.
Condition & rehab AI · 13 photos
This brand new 439 square foot tiny home on a 1-acre lot in Nancy, Kentucky is move-in ready with excellent condition and minimal maintenance required.
Value-add opportunities
- Both Landscaping and curb appeal — Enhances curb appeal and resale value
- Both Addition of modern appliances — Improves functionality and rental appeal
Renovation cost estimate screening
Value-add ROI direction
- Both Landscaping and curb appeal — Enhances curb appeal and resale value ↑
- Both Addition of modern appliances — Improves functionality and rental appeal ↑
ⓘ Cost ranges are severity-bucket heuristics (US national rule-of-thumb). Get contractor quotes + a written scope before underwriting a rehab budget.
Schools (NCES district)
- District
- Wayne County
- NCES district ID
- 2105790
- Math proficiency
- 20% ▼ -21.00%
- Reading proficiency
- 33% ▼ -21.00%
- Median HH income
- $30,391
- Composite
- 21.38/100
- National rank
- #8358
- State rank
- #142 of 165 in KY
Livability — Monticello
- Score
- 65/100
- State rank
- #265
- US rank
- #12963
Category grades
Schools grade is shown separately in the Schools card above.
Census & demographics
- Population (ZIP)
- 5,731
Population outlook (Wayne County) Hauer SSP2
- Today (2025)
- 19,477 people
- By 2030
- 18,776 · -3.6%
- By 2040
- 17,199 · -11.7%
- By 2050
- 15,602 · -19.9%
- By 2075
- 11,883 · -39.0%
- By 2100
- 8,300 · -57.4%
Race, ethnicity, and origin ACS 2023
- Neighborhood character
- Predominantly White (96%)
- Race & ethnicity
- White 96% Asian 2% Two or more races 1%
- Common ancestry
- Serbian 4% Romanian 2% Italian 2%
- Foreign-born
- 1% · Vietnam
- Languages at home
- 98% English-only · Other Indo-European 1% Chinese 1% Vietnamese 1%
Political lean MEDSL · Wayne
- 2024 margin
- Solid R (+66.0) · D 16.5% · R 82.5%
- 2008→2024 swing
- -28.9pp toward R · 2008: -37.1pp · 2024: -66.0pp
- All cycles
- 2024: R+66.0 2020: R+62.0 2016: R+61.8 2012: R+47.6 2008: R+37.1
Not yet ingested
- Civics
- —
Market trends
- HPI YoY
- ▼ -0.05%
- Current HPI
- 273.9998
- Rent YoY
- —
- Metro
- —
- State GDP YoY
- ▲ 1.81%
- F500 in state
- 4
Industry mix (Fortune 500 HQ in KY)
| Industry | F500 HQs | Revenue |
|---|---|---|
| Healthcare | 1 | $118B |
|
||
| Food / Beverage | 1 | $7B |
|
||
Price history
-5.0% since first listed14 events — show timeline
- 2026-04-18 Pending — ImagineMLS
- 2026-03-27 Price Changed $94,900 ImagineMLS
- 2026-03-18 Price Changed $97,000 ImagineMLS
- 2026-03-06 Price Changed $97,900 ImagineMLS
- 2026-02-24 Relisted — ImagineMLS
- 2026-02-18 Contingent — ImagineMLS
- 2026-01-23 Price Changed $99,000 ImagineMLS
- 2026-01-07 Price Changed $100,000 ImagineMLS
- 2025-12-03 Price Changed $97,400 ImagineMLS
- 2025-10-31 Price Changed $97,900 ImagineMLS
- 2025-10-21 Price Changed $98,900 ImagineMLS
- 2025-10-08 Price Changed $99,400 ImagineMLS
- 2025-09-29 Price Changed $99,500 ImagineMLS
- 2025-09-05 Listed $99,900 ImagineMLS
Cash-flow waterfall
monthlySold comps — $/sqft
last 12 mo · ≤1 miLoading sold comps…