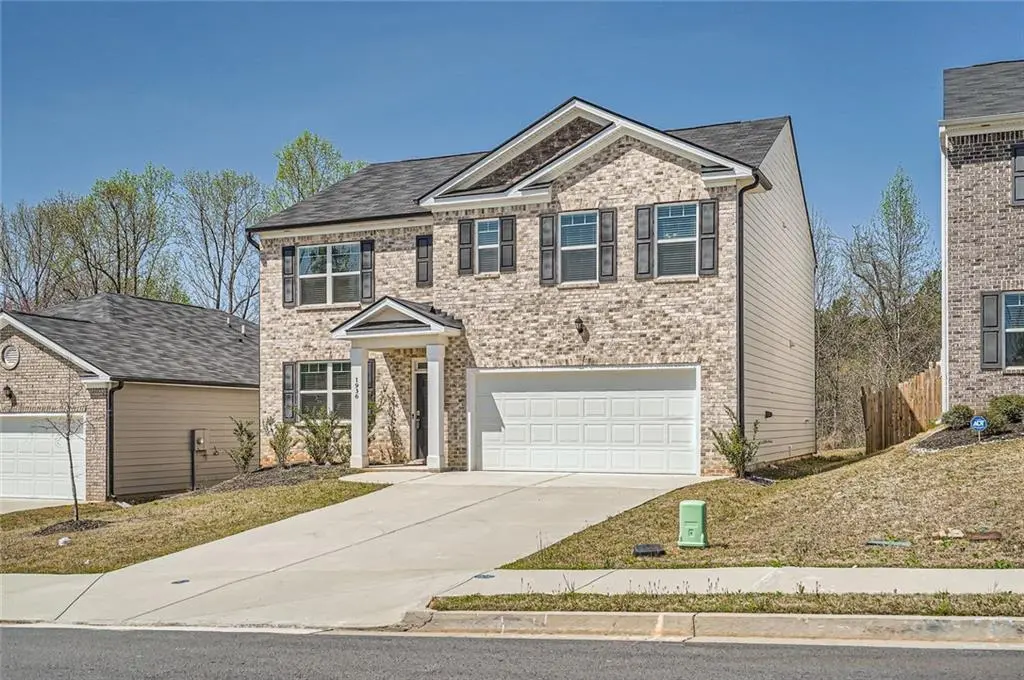
1936 Waycross Ln
Dacula, GA 30019
$399,000D-
5 bd · 3.0 ba ·
2,535 sqft ·
Built 2022
· SingleFamily
· Active
· 3 DOM
Cashflow @ list (25.0% down · 7.5%)
Estimated rent
$3,149/mo
Mortgage (P&I)
−$2,092
Tax + insurance
−$738
HOA
−$67
Vac / Maint / Mgmt
−$661
Net cashflow
$-410/mo
Annual
$-4,917/yr
Cap rate
5.06%
Cash-on-cash
-4.40%
DSCR
0.80
1% rule
0.79%
Cash to close
$111,720
Investor read
- This is a 5-bed/3.0-bath single-family listed at $399k.
- At list price, monthly cash flow is $-410 ($-5k/yr) — negative.
- To cash-flow at today's rent, offer at most $327k (18.1% below list).
- To meet the 1% rule (rent ≥ 1% of price), the offer needs to be $315k (21.1% below list).
- Only 3 days on market — expect competitive offers; lowballing is unlikely to land.
- Recommended offer: $315k (21.1% below list) — sets the bar for 1% rule.
- Local home prices are declining (-3.0%/yr); year-one equity from $3k of loan paydown is wiped out by about $12k of value loss. Plan a longer hold.
- Location reads 65/100 on livability (#211 in GA) — a middle-class / working-renter tenant base. Strengths: cost of living A+, housing A+, crime B; Watch: amenities F, commute F, health & safety D-.
- Gwinnett County (suburban): math 39% / reading 43% proficiency, ranked #32 of 174 in GA (top 18%) — families likely to look elsewhere, expect single-tenant / working-renter base with shorter leases.
- Market conditions: Rents rising fast (+4.1%/yr); 643 active listings in the ZIP; 18 comparable units currently listed for rent nearby; rentals at typical pace (median 15d on market — plan ~3-4 weeks tenant-placement turnaround); high-income renter base; 5,607 units permitted in Gwinnett County in 2024 (1,277 in 5+ unit buildings).
- Gwinnett County population projected at +47% by 2050 — long-run rental-demand tailwind backs the buy-and-hold thesis.
- 11 sale attempts since 2y ago; this cycle's ask has dropped $36k (8%) from the opening price — seller is motivated, your offer sets the floor, not the list.
- Climate carrying-cost: extreme-heat days projected 7→17/yr by 2055 (HVAC capex compounding) — expect insurance premiums to compound above CPI over the hold.
- Cap rate 5.1% vs local median 4.1% in Dacula — meaningfully above typical; check what's discounted (condition, days-on-market, listing class) to confirm the premium yield is real.
- This rent runs 32% of the median local income ($117k/yr) — at the standard rent-burdened threshold; future hikes will face affordability resistance.
Questions for listing agent
- What do current leases actually rent for vs. the listed asking? Can we see a recent rent roll and the last 12 months of T-12 income?
- What does the HOA fee cover, when was the last increase, and are there any pending special assessments or reserve-fund shortfalls?
- Is there a deadline driving the sale (1031 exchange, divorce, estate, relocation)? That informs how much negotiation room exists.
- The area grade is low — what's the realistic commute time and amenity access for the typical tenant pool here? Any planned neighborhood developments (good or bad) we should know about?
- What's the average days-on-market for RENTAL listings here right now (not sales)? A rising rental-DOM trend means longer vacancies and softer asking-rent achievability than the comps imply.
- What's the recent tenant-quality profile in this submarket — average credit score on applications, eviction rate, late-payment / NSF rate, and stable-employment percentage? A property-management company in the area should have these aggregated.
- How much new for-sale + rental construction is in the pipeline within 1–3 miles? Heavy new supply typically softens prices + rents 12–24 months out; constrained supply supports both.
CashFlowRE · CFR-XF75R969GSFFEZ
· Data 2 days ago
cashflowre.app · 2026-05-29