2516 Kinsale Ln
Ormond Beach, FL 32174
$304,990B
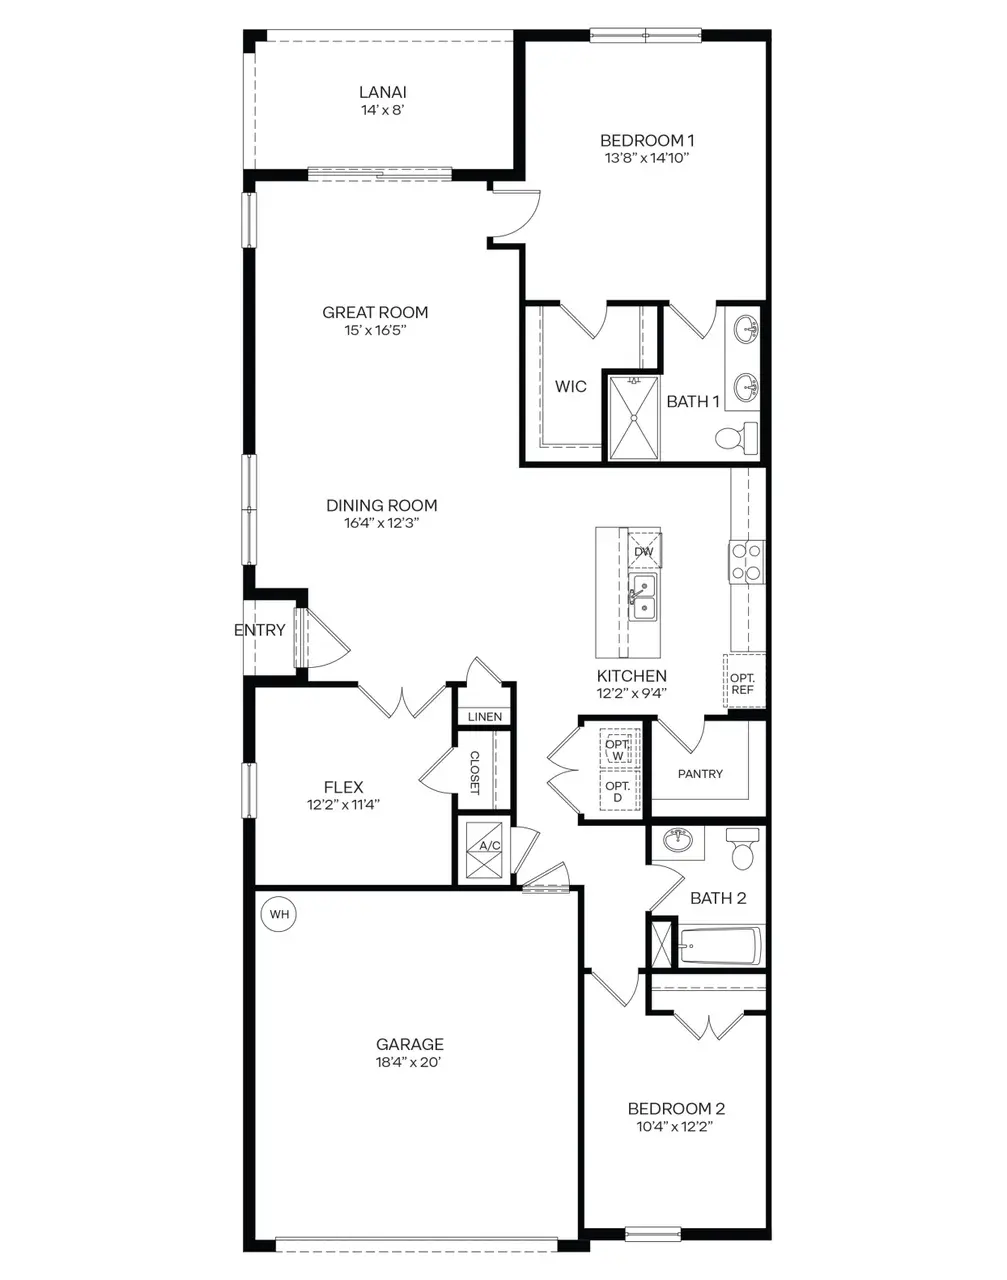
3 bd · 2.0 ba ·
1,564 sqft ·
Built 2026
· MultiFamily
· Active
· 15 DOM
Cashflow @ list (25.0% down · 7.5%)
Estimated rent
$5,298/mo
Mortgage (P&I)
−$1,599
Tax + insurance
−$508
HOA
−$0
Vac / Maint / Mgmt
−$1,113
Net cashflow
$2,078/mo
Annual
$24,932/yr
Cap rate
14.47%
Cash-on-cash
29.20%
DSCR
2.30
1% rule
1.74%
Cash to close
$85,397
Investor read
- This is a 3-bed/2.0-bath multifamily listed at $305k. Condition is rated fair.
- At list price, monthly cash flow is $2k ($25k/yr) — positive.
- The deal already cash-flows at list — no discount required.
- Meets the 1% rule at list price ($5k rent vs $305k).
- It's been on market 15 days — a 2% lower offer ($300k) is reasonable based on typical stale-listing flexibility.
- Recommended offer: $300k (1.5% below list) — sets the bar for market timing.
- Local home prices are declining (-3.0%/yr); year-one equity from $2k of loan paydown is wiped out by about $9k of value loss. Plan a longer hold.
- Location reads 83/100 on livability (#55 in FL, #965 nationally) — a professional / high-income tenant draw. Strengths: amenities A+, housing A+, health & safety A+; Watch: commute F.
- Volusia (suburban): math 44% / reading 49% proficiency, ranked #47 of 73 in FL (top 64%) — families likely to look elsewhere, expect single-tenant / working-renter base with shorter leases.
- Market conditions: Rents rising (+1.6%/yr); 985 active listings in the ZIP; 8 comparable units currently listed for rent nearby; rentals at typical pace (median 15d on market — plan ~3-4 weeks tenant-placement turnaround); 3,402 units permitted in Volusia County in 2024 (681 in 5+ unit buildings).
- Volusia County population projected at +19% by 2050 — long-run rental-demand tailwind backs the buy-and-hold thesis.
- At projected returns (-3.0% appreciation + 1.6% rent growth), your $85k cash investment doubles in ~5 years — after that, you're playing with house money.
- Cap rate 14.5% vs local median 3.9% in Ormond Beach — top-decile yield for the area; either an underpriced asset or a hidden risk that comps aren't pricing in. Stress-test before assuming the spread holds.
- At $5,298/mo this rent would consume 90% of the median local household income ($71k/yr) (locally 1158% of renters already pay >50% of income on rent) — very limited rent-growth headroom before tenants either downsize or default.
Questions for listing agent
- Have any recent inspections been done? Can we get a copy of the seller's disclosures and any deferred-maintenance estimates?
- Is there a deadline driving the sale (1031 exchange, divorce, estate, relocation)? That informs how much negotiation room exists.
- Schools are B-rated — typically a magnet for longer-tenancy family renters. What's the average tenant stay here, and is there a school-zone premium baked into asking?
- What's the average days-on-market for RENTAL listings here right now (not sales)? A rising rental-DOM trend means longer vacancies and softer asking-rent achievability than the comps imply.
- What's the recent tenant-quality profile in this submarket — average credit score on applications, eviction rate, late-payment / NSF rate, and stable-employment percentage? A property-management company in the area should have these aggregated.
- How much new apartment / multifamily construction is in the pipeline within 1–3 miles? Heavy new supply (>2% of stock underway) typically softens rents 12–24 months out; light construction supports rent growth.
Repairs flagged (vision-AI assessment)
- Minor: Paint — Paint appears slightly faded
CashFlowRE · CFR-XFP0KZ28FPAF1Y
· Data 2 days ago
cashflowre.app · 2026-05-29