 Multi-family
2516 Kinsale Ln · Ormond Beach, FL
Flood risk No data
- FEMA flood zone
- —
- Chance of flooding over 30 yrs
- —
- Est. flood insurance / yr
- —
Fire risk No data
- Est. fire insurance / yr
- —
Heat risk No data
- Hot days now (above threshold)
- —
- Hot days in 30 yrs
- —
Wind risk No data
- Chance of severe wind over 30 yrs
- —
Air-quality risk No data
- Unhealthy air days now
- —
- Unhealthy air days in 30 yrs
- —
Risk factors via First Street. Map © Google.
Why this score? — see what drove the B grade
The composite is a weighted blend of 9 inputs, each scored 0–100. Each bar is that input's sub-score; the figure is the points it added to the 100-point composite (weight × sub-score).
- Cash flow +30.0/30.0
- 1% rule +10.0/10.0
- DSCR +10.0/10.0
- ARV discount +7.5/15.0
- Livability +4.2/5.0
- Schools +3.9/10.0
- Rent growth +2.9/5.0
- Condition / age +2.2/5.0
- Appreciation +0.0/10.0
$304,990
🖨 Deal sheet 📄 Offer letter ✓ Due diligence
Listing remarks
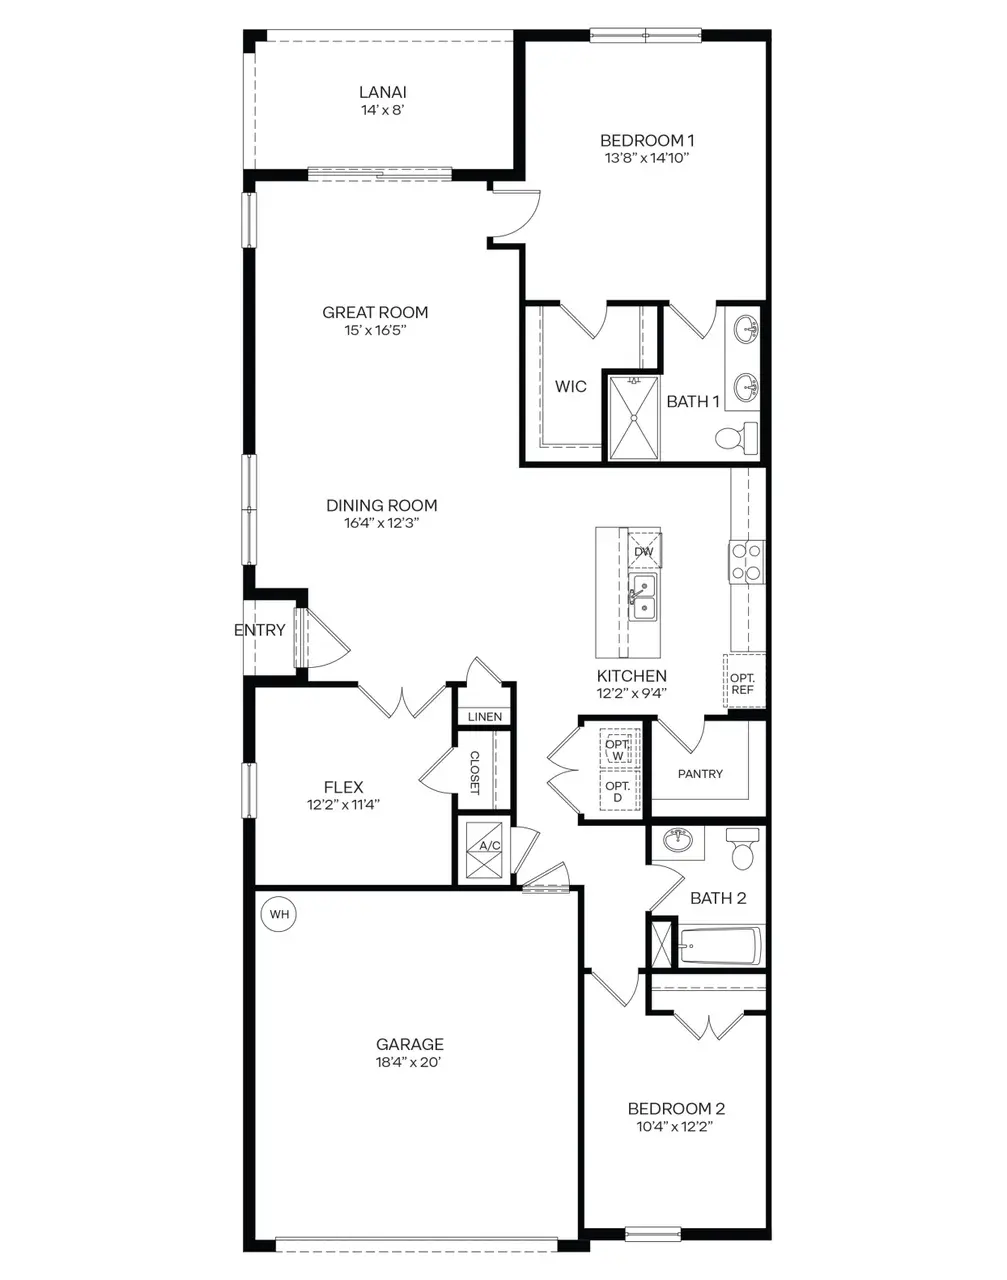
The property is located at 2516 Kinsale Lane ORMOND BEACH FL 32174 priced at 304990, the square foot and stories are 1564, 1.The number of bath is 2, halfbath is 0 there are 3 bedrooms and 2 garages. For more details please, call or email.
Key facts
- 2 garage spots
- Built 2026
- Listed 15 days
Property features AI
Finance
- Other: Active listing; List price $307,990
Exterior
- Parking: 2-car garage (total 2 parking spaces)
- Home design: Spec-built Carrington plan
- Exterior features: Living area approximately 1,564
Interior
- Kitchen: Carrington plan kitchen (spec home)
- Bedrooms: 3 bedrooms
- Bathrooms: 2 full bathrooms
- Interior features: Open living area
Neighborhood map
What this means for you Summary
Snapshot
- This is a 3-bed/2.0-bath multifamily listed at $305k. Condition is rated fair.
Deal economics
- At list price, monthly cash flow is $2k ($25k/yr) — positive.
- The deal already cash-flows at list — no discount required.
- Meets the 1% rule at list price ($5k rent vs $305k).
- Recommended offer: $300k (1.5% below list) — sets the bar for market timing.
- Cap rate 14.5% vs local median 3.9% in Ormond Beach — top-decile yield for the area; either an underpriced asset or a hidden risk that comps aren't pricing in. Stress-test before assuming the spread holds.
Location & tenants
- Location reads 83/100 on livability (#55 in FL, #965 nationally) — a professional / high-income tenant draw. Strengths: amenities A+, housing A+, health & safety A+; Watch: commute F.
- Volusia (suburban): math 44% / reading 49% proficiency, ranked #47 of 73 in FL (top 64%) — families likely to look elsewhere, expect single-tenant / working-renter base with shorter leases.
- Market conditions: Rents rising (+1.6%/yr); 985 active listings in the ZIP; 8 comparable units currently listed for rent nearby; rentals at typical pace (median 15d on market — plan ~3-4 weeks tenant-placement turnaround); 3,402 units permitted in Volusia County in 2024 (681 in 5+ unit buildings).
- At $5,298/mo this rent would consume 90% of the median local household income ($71k/yr) (locally 1158% of renters already pay >50% of income on rent) — very limited rent-growth headroom before tenants either downsize or default.
Forward outlook
- Local home prices are declining (-3.0%/yr); year-one equity from $2k of loan paydown is wiped out by about $9k of value loss. Plan a longer hold.
- Volusia County population projected at +19% by 2050 — long-run rental-demand tailwind backs the buy-and-hold thesis.
- At projected returns (-3.0% appreciation + 1.6% rent growth), your $85k cash investment doubles in ~5 years — after that, you're playing with house money.
Negotiation context
- It's been on market 15 days — a 2% lower offer ($300k) is reasonable based on typical stale-listing flexibility.
Questions for the listing agent
- Have any recent inspections been done? Can we get a copy of the seller's disclosures and any deferred-maintenance estimates?
- Is there a deadline driving the sale (1031 exchange, divorce, estate, relocation)? That informs how much negotiation room exists.
- Schools are B-rated — typically a magnet for longer-tenancy family renters. What's the average tenant stay here, and is there a school-zone premium baked into asking?
- What's the average days-on-market for RENTAL listings here right now (not sales)? A rising rental-DOM trend means longer vacancies and softer asking-rent achievability than the comps imply.
- What's the recent tenant-quality profile in this submarket — average credit score on applications, eviction rate, late-payment / NSF rate, and stable-employment percentage? A property-management company in the area should have these aggregated.
- How much new apartment / multifamily construction is in the pipeline within 1–3 miles? Heavy new supply (>2% of stock underway) typically softens rents 12–24 months out; light construction supports rent growth.
Investment metrics
- 1% rule
- 1.74% ✓
- Cap rate
- 14.47%
- Cash-on-cash
- 29.20%
- DSCR
- 2.30
- GRM
- 4.8
CMA / ARV
No comps found within radius.
Projected returns pro-forma
-3.0% appreciation · 1.64% rent growth · sell at horizon
- IRR
- 22.1%
- Equity multiple
- 1.89×
- Total profit
- $75,835
- Equity at exit
- $45,475
- IRR
- 29.2%
- Equity multiple
- 3.44×
- Total profit
- $208,197
- Equity at exit
- $26,370
Cash invested: $85,397 (down + closing). Projections, not guarantees.
Landlord ↔ Tenant lean methodology
- Overall (STATE)
- 87 Strongly Landlord-Friendly
- State Florida
- 87 Strongly Landlord-Friendly · R+3
- County
- — inherits STATE
- City
- — inherits STATE
ZIP-level market 32174
- Rents YoY
- 1.6%
- Active inventory
- 985
- Price-to-rent
- 14.4×
Monthly cashflow live
- Estimated rent
- $5,298 medium interval (Pro) →
- Mortgage (P&I)
- −$1,599
- Tax est. 1.5%
- −$381 /mo · $4,575/yr
- Insurance
- −$127
- HOA
- −$0
- Vacancy / Maint / Mgmt
- −$1,113
- Net cashflow
- $2,078
Break-even live
3-unit breakdown (identical units grouped — click to expand)
| Units | Beds | Baths | Est. rent |
|---|---|---|---|
| 3× units | 3 | 2 | $5,298 |
| #1 | 3 | 2 | $1,766 |
| #2 | 3 | 2 | $1,766 |
| #3 | 3 | 2 | $1,766 |
| Total (3 units) | $5,298 | ||
UW: 25.0% down · 7.5% · 30yr · 1.5% tax · 5.0% vac · 8.0% maint · 8.0% mgmt
Financing live
Cash to close
- Down payment
- $76,248
- Closing costs
- $9,150
- Reserves months
- —
- Total cash needed
- —
Loan-product check · same deal, 3 products live
Conventional
25% down · 7.5% · 30yr
- Down + closing
- —
- Monthly P&I
- —
- Monthly cashflow
- —
- DSCR
- —
- Eligible?
- —
Personal DTI + credit; lowest rate.
DSCR
20% down · 8.5% · 30yr
- Down + closing
- —
- Monthly P&I
- —
- Monthly cashflow
- —
- DSCR
- —
- Eligible?
- —
No personal income docs; deal must DSCR.
Hard money
10% down · 12.0% · 12mo
- Down + closing
- —
- Monthly P&I
- —
- Monthly cashflow
- —
- DSCR
- —
- Eligible?
- —
Short-term bridge; refi at stabilization.
Rent comps 8 comps
| Address | Beds | Baths | Sqft | Rent | $/sqft | DOM | Units | Dist |
|---|---|---|---|---|---|---|---|---|
| 1028 Kilkenny Ln Ormond Beach, FL | 3.0 | 2.0 | 1501 | $2,400 | $1.60 | 2d | 1 | 0.28mi |
| 1326 Middle Lake Dr Ormond Beach, FL | 4.0 | 2.0 | 1846 | $2,600 | $1.41 | 23d | 1 | 0.28mi |
| 1119 Hansberry Ct Ormond Beach, FL | 2.0 | 3.0 | 1604 | $2,550 | $1.59 | 2d | 1 | 0.37mi |
| 1312 Hansberry Ln Ormond Beach, FL | 2.0 | 3.0 | 1604 | $2,300 | $1.43 | 11d | 1 | 0.46mi |
| 1312 Hansberry Ln Ormond Beach, FL | 2.0 | 3.0 | 1604 | $2,250 | $1.40 | 2d | 1 | 0.46mi |
| 1427 Carlow Cir Ormond Beach, FL | 3.0 | 2.0 | 1684 | $2,059 | $1.22 | 23d | 1 | 0.72mi |
| 3132 Connemara Dr Ormond Beach, FL | 3.0 | 2.0 | 1670 | $2,200 | $1.32 | 19d | 1 | 1.24mi |
| 5 Villa Lago Ln Ormond Beach, FL | 3.0 | 2.0 | 1935 | $2,345 | $1.21 | 14d | 1 | 1.47mi |
Listing history 12 events
-
2026-06-18days on market $304,990 Active 15 DOM
-
2026-06-17price $304,990 Active 14 DOM
-
2026-06-17days on market $307,990 Active 14 DOM
-
2026-06-16days on market $307,990 Active 13 DOM
-
2026-06-15days on market $307,990 Active 12 DOM
-
2026-06-14days on market $307,990 Active 10 DOM
-
2026-06-10days on market $307,990 Active 7 DOM
-
2026-06-09days on market $307,990 Active 6 DOM
-
2026-06-08days on market $307,990 Active 5 DOM
-
2026-06-07days on market $307,990 Active 4 DOM
-
2026-06-03remarks 239-char remark
-
2026-06-03$307,990 Active 1 DOM
ⓘ Source: listings_history table (triggers on properties + properties_extension) + one-shot
backfill from property_details.listing_events for pre-trigger history.
Nearby sold comps map
Loading sold comps map…
Walkable amenities ~0.75 mi
Loading nearby amenities…
Taxation est. · year 1
- Rental income
- $63,576
- − Mortgage interest
- −$17,084
- − Property taxes
- −$4,575
- − Insurance
- −$1,525
- − Repairs & maintenance
- −$5,086
- − Management
- −$5,086
- − Depreciation
- −$8,872
- Taxable income
- $21,347
- Est. tax owed @ 24.0%
- −$5,123
- After-tax cash flow
- $19,809/yr
For passive investors: Depreciation is non-cash, so a rental often shows a tax loss while cash-flowing — sheltering income. Rental losses are passive: they offset passive income freely, and up to $25,000/yr can offset ordinary (W-2) income if you actively participate and your MAGI is under $100k (phasing out to $0 by $150k); unused losses carry forward. On sale, claimed depreciation is recaptured at up to 25%, and gains may owe capital-gains tax (a 1031 exchange can defer both). Figures are a year-1 estimate at your 24.0% rate — not tax advice; consult a CPA.
Condition & rehab AI · 1 photo
The property is in fair condition with average systems and minimal visible wear. Painting and window cleaning would significantly enhance its curb appeal and interior aesthetics, boosting both resale and rental value.
Repairs flagged
- Minor Paint — Paint appears slightly faded
Value-add opportunities
- Both Painting — Fresh paint enhances curb appeal and interior aesthetics
- Both Window cleaning — Clean windows improve natural light and overall appearance
Renovation cost estimate screening
| Repair item | Severity | Est. cost |
|---|---|---|
| Paint · Paint appears slightly faded | Minor | $500–3,000 |
| Total estimated repair cost · 1 items | $500–3,000 |
Value-add ROI direction
- Both Painting — Fresh paint enhances curb appeal and interior aesthetics ↑
- Both Window cleaning — Clean windows improve natural light and overall appearance ↑
ⓘ Cost ranges are severity-bucket heuristics (US national rule-of-thumb). Get contractor quotes + a written scope before underwriting a rehab budget.
Schools (NCES district)
- District
- Volusia
- NCES district ID
- 1201920
- Math proficiency
- 44% ▼ -9.00%
- Reading proficiency
- 49% ▼ -3.00%
- Median HH income
- $42,946
- Composite
- 39.2/100
- National rank
- #4019
- State rank
- #47 of 73 in FL
Livability — Ormond Beach
- Score
- 83/100
- State rank
- #55
- US rank
- #965
Category grades
Schools grade is shown separately in the Schools card above.
Census & demographics
- County
- Volusia County · 556,871 people
- City population
- 69,624
- Metro
- Deltona-Daytona Beach-Ormond Beach, FL
- Population (ZIP)
- 54,783
- Household income
- $71,011
- Rent vs Own
- Severe rent burden
- 1158.0
Population outlook (Volusia County) Hauer SSP2
- Today (2025)
- 572,749 people
- By 2030
- 598,695 · +4.5%
- By 2040
- 644,880 · +12.6%
- By 2050
- 681,451 · +19.0%
- By 2075
- 759,957 · +32.7%
- By 2100
- 778,902 · +36.0%
Race, ethnicity, and origin ACS 2023
- Neighborhood character
- Predominantly White (82%)
- Race & ethnicity
- White 82% Black 6% Hispanic / Latino 5% Two or more races 5% Asian 3%
- Hispanic origin (detail)
- Puerto Rican 2%
- Common ancestry
- Romanian 4% Lithuanian 3% Slovak 3%
- Foreign-born
- 7% · Canada, China
- Languages at home
- 91% English-only · Spanish 3% Other Indo-European 1% German/W. Germanic 1%
Political lean MEDSL · Volusia
- 2024 margin
- Strong R (+21.8) · D 38.7% · R 60.5%
- 2008→2024 swing
- -27.4pp toward R · 2008: 5.7pp · 2024: -21.8pp
- All cycles
- 2024: R+21.8 2020: R+14.1 2016: R+13.1 2012: R+1.2 2008: D+5.7
Not yet ingested
- Civics
- —
Market trends
- HPI YoY
- ▼ -327.97%
- Current HPI
- 271.92
- Rent YoY
- ▲ 1.64%
- Metro
- Deltona-Daytona Beach-Ormond Beach, FL
- State GDP YoY
- ▲ 3.28%
- F500 in state
- 36
Industry mix (Fortune 500 HQ in FL)
| Industry | F500 HQs | Revenue |
|---|---|---|
| Industrial Technology | 2 | $29B |
|
||
| Insurance | 2 | $17B |
|
||
| Retail | 1 | $60B |
|
||
| Technology Distribution | 1 | $58B |
|
||
| Homebuilding | 1 | $35B |
|
||
| Technology Manufacturing | 1 | $35B |
|
||
Cash-flow waterfall
monthlySold comps — $/sqft
last 12 mo · ≤1 miLoading sold comps…