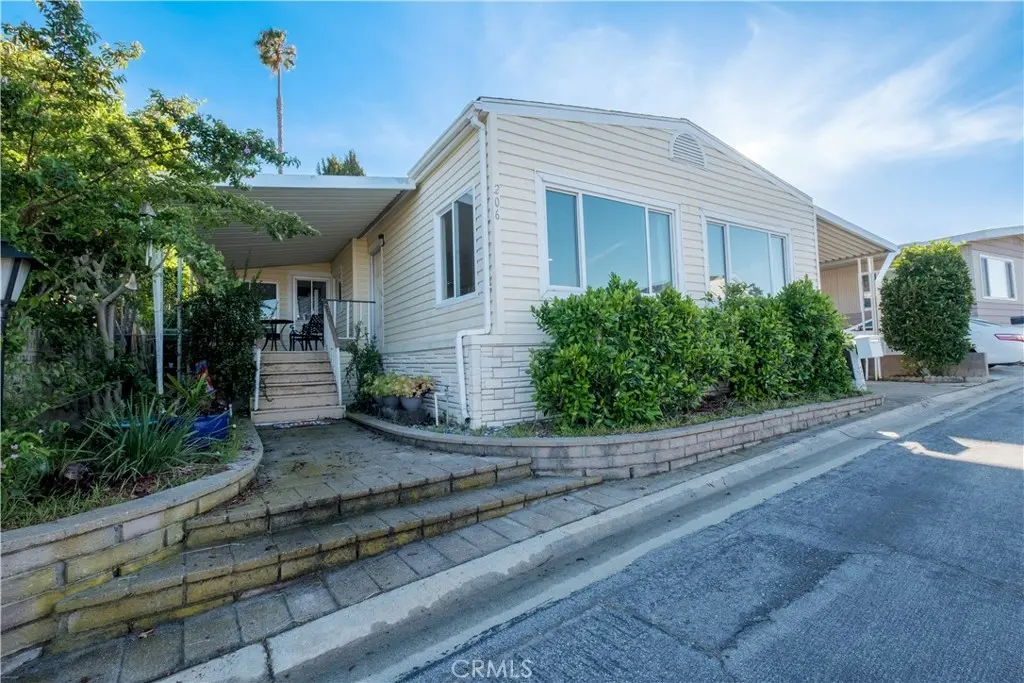
2550 pacific coast Hwy #206
Redondo Beach, CA 90505
$175,000B-
2 bd · 2.0 ba ·
1,440 sqft ·
Built 1971
· Manufactured
· Active
· 62 DOM
Cashflow @ list (25.0% down · 7.5%)
Estimated rent
$5,043/mo
Mortgage (P&I)
−$918
Tax + insurance
−$292
HOA
−$0
Vac / Maint / Mgmt
−$1,059
Net cashflow
$2,775/mo
Annual
$33,297/yr
Cap rate
25.32%
Cash-on-cash
67.95%
DSCR
4.02
1% rule
2.88%
Cash to close
$49,000
Investor read
- This is a 2-bed/2.0-bath manufactured listed at $175k.
- At list price, monthly cash flow is $3k ($33k/yr) — positive.
- The deal already cash-flows at list — no discount required.
- Meets the 1% rule at list price ($5k rent vs $175k).
- It's been on market 62 days — a 6% lower offer ($164k) is reasonable based on typical stale-listing flexibility.
- Recommended offer: $164k (6.0% below list) — sets the bar for market timing.
- Local home prices are declining (-3.0%/yr); year-one equity from $1k of loan paydown is wiped out by about $5k of value loss. Plan a longer hold.
- Location reads 79/100 on livability (#58 in CA, #2,124 nationally) — a middle-class / working-renter tenant base. Strengths: schools A+, amenities A+, employment A+; Watch: health & safety C-, cost of living F.
- Redondo Beach Unified (suburban): math 72% / reading 78% proficiency, ranked #63 of 1,400 in CA (top 4%) — strong family-tenant draw, lease renewals of 3-5y typical; only 14% free/reduced lunch — higher-income household profile.
- Market conditions: Rents rising fast (+4.5%/yr); 63 active listings in the ZIP; 40 comparable units currently listed for rent nearby; rentals lingering (median 44d on market — plan ~5-8 weeks vacancy on turnover, expect pricing pressure); 58% of comp listings sitting > 30 days — soft ceiling on asking rent; high-income renter base; 19,697 units permitted in Los Angeles County in 2024 (9,426 in 5+ unit buildings).
- Los Angeles County population projected at +9% by 2050 — modest demand growth; plan on rents tracking national, not racing it.
- 5 sale attempts since 20y ago; this cycle's ask has dropped $40k (19%) from the opening price — seller is motivated, your offer sets the floor, not the list.
- At projected returns (-3.0% appreciation + 4.5% rent growth), your $49k cash investment doubles in ~2 years — after that, you're playing with house money.
- Cap rate 25.3% vs local median 1.9% in Redondo Beach — top-decile yield for the area; either an underpriced asset or a hidden risk that comps aren't pricing in. Stress-test before assuming the spread holds.
- At $5,043/mo this rent would consume 52% of the median local household income ($116k/yr) (locally 1527% of renters already pay >50% of income on rent) — very limited rent-growth headroom before tenants either downsize or default.
Questions for listing agent
- It's been on market 62 days. Have you received any prior offers? Is the seller open to a 6% concession, seller financing, or rate buy-down credit?
- Built in 1971 — when were the roof, HVAC, electrical panel, plumbing, and water heater last replaced?
- Why hasn't it sold? Are there any deal-killer items the seller is aware of (foundation, flood, title, zoning, code violations)?
- Is there a deadline driving the sale (1031 exchange, divorce, estate, relocation)? That informs how much negotiation room exists.
- Schools are A-rated — typically a magnet for longer-tenancy family renters. What's the average tenant stay here, and is there a school-zone premium baked into asking?
- What's the average days-on-market for RENTAL listings here right now (not sales)? A rising rental-DOM trend means longer vacancies and softer asking-rent achievability than the comps imply.
- What's the recent tenant-quality profile in this submarket — average credit score on applications, eviction rate, late-payment / NSF rate, and stable-employment percentage? A property-management company in the area should have these aggregated.
- How much new for-sale + rental construction is in the pipeline within 1–3 miles? Heavy new supply typically softens prices + rents 12–24 months out; constrained supply supports both.
CashFlowRE · CFR-XHCMCJ9EZERSTC
· Data 2 days ago
cashflowre.app · 2026-05-29