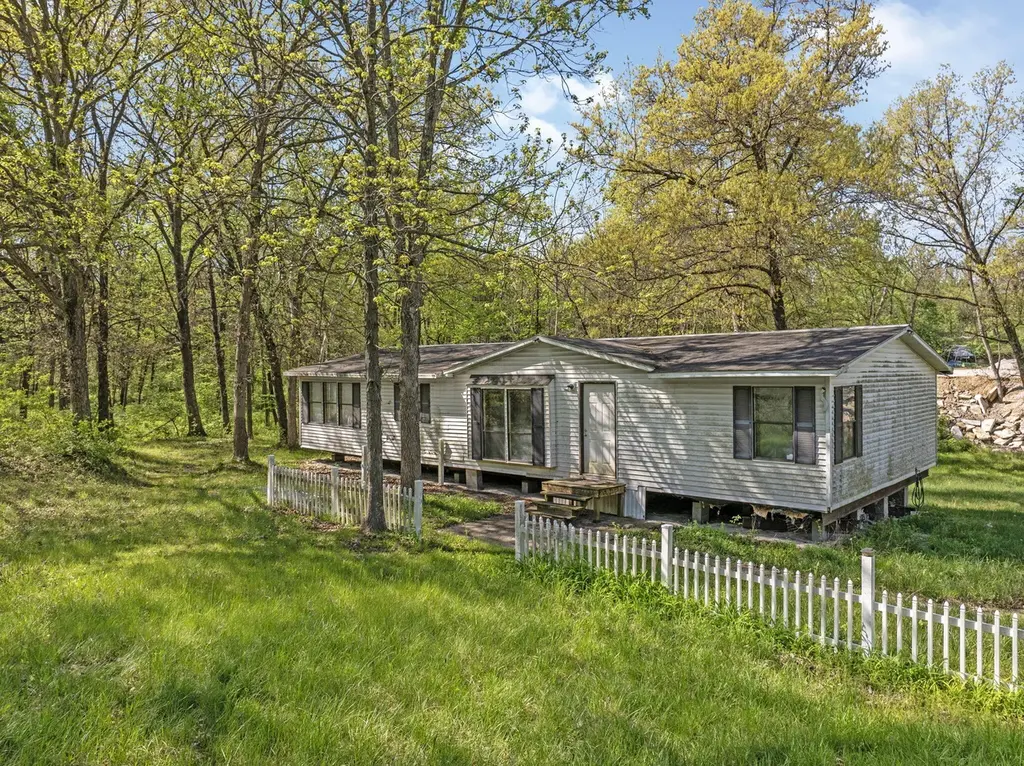
7304 N Wagon Trail Rd
Columbia, MO 65202
$125,000B+
3 bd · 2.0 ba ·
1,521 sqft ·
Built —
· Manufactured
· Pending
· 33 DOM
Cashflow @ list (25.0% down · 7.5%)
Estimated rent
$1,610/mo
Mortgage (P&I)
−$656
Tax + insurance
−$76
HOA
−$0
Vac / Maint / Mgmt
−$338
Net cashflow
$540/mo
Annual
$6,475/yr
Cap rate
11.47%
Cash-on-cash
18.50%
DSCR
1.82
1% rule
1.29%
Cash to close
$35,000
Investor read
- This is a 3-bed/2.0-bath manufactured listed at $125k.
- At list price, monthly cash flow is $540 ($6k/yr) — positive.
- The deal already cash-flows at list — no discount required.
- Meets the 1% rule at list price ($2k rent vs $125k).
- It's been on market 33 days — a 3% lower offer ($121k) is reasonable based on typical stale-listing flexibility.
- Recommended offer: $121k (3.0% below list) — sets the bar for market timing.
- Local home prices are declining (-3.0%/yr); year-one equity from $864 of loan paydown is wiped out by about $4k of value loss. Plan a longer hold.
- Location reads 83/100 on livability (#9 in MO, #862 nationally) — a professional / high-income tenant draw. Strengths: amenities A+, commute A+, cost of living A+; Watch: crime D+.
- Hallsville R-IV (rural): math 45% / reading 45% proficiency, ranked #87 of 324 in MO (top 27%) — families likely to look elsewhere, expect single-tenant / working-renter base with shorter leases.
- Zoned schools: Hallsville Primary (351 students, 28% FRL); Hallsville Middle (math 48% / reading 44%, grade D+, #102 of 391 statewide, top 26%, 365 students, 28% FRL); Hallsville High (math 52% / reading 47%, grade D, #124 of 521 statewide, top 28%, 448 students, 25% FRL) — zoned schools at 27% FRL track the district average.
- Market conditions: Rents rising fast (+6.0%/yr); 351 active listings in the ZIP; 1 comparable units currently listed for rent nearby; 1,303 units permitted in Boone County in 2024 (549 in 5+ unit buildings).
- Boone County population projected at +36% by 2050 — long-run rental-demand tailwind backs the buy-and-hold thesis.
- 5 sale attempts since 21y ago with the ask held roughly flat each time — persistent listings suggest the price (not the market) is what's stuck; bring a comps-based counter.
- At projected returns (-3.0% appreciation + 6.0% rent growth), your $35k cash investment doubles in ~6 years — after that, you're playing with house money.
- Cap rate 11.5% vs local median 2.9% in Columbia — top-decile yield for the area; either an underpriced asset or a hidden risk that comps aren't pricing in. Stress-test before assuming the spread holds.
Questions for listing agent
- It's been on market 33 days. Have you received any prior offers? Is the seller open to a 3% concession, seller financing, or rate buy-down credit?
- Is there a deadline driving the sale (1031 exchange, divorce, estate, relocation)? That informs how much negotiation room exists.
- Schools are B-rated — typically a magnet for longer-tenancy family renters. What's the average tenant stay here, and is there a school-zone premium baked into asking?
- Crime grade is D in this area — have there been break-ins, vandalism, or insurance claims at this property in the last 3 years? What carrier currently insures it and at what premium?
- What's the average days-on-market for RENTAL listings here right now (not sales)? A rising rental-DOM trend means longer vacancies and softer asking-rent achievability than the comps imply.
- What's the recent tenant-quality profile in this submarket — average credit score on applications, eviction rate, late-payment / NSF rate, and stable-employment percentage? A property-management company in the area should have these aggregated.
- How much new for-sale + rental construction is in the pipeline within 1–3 miles? Heavy new supply typically softens prices + rents 12–24 months out; constrained supply supports both.
CashFlowRE · CFR-XHP7PF46R2VBYS
· Data 3 weeks ago
cashflowre.app · 2026-05-29