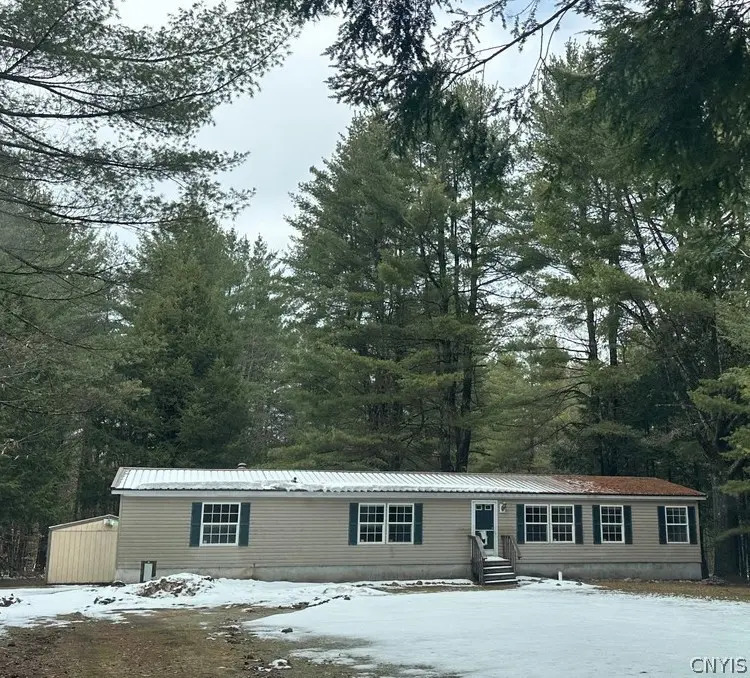
1085 County Route 17
Cleveland, NY 13028
$159,900D+
3 bd · 2.0 ba ·
1,836 sqft ·
Built 1996
· SingleFamily
· Pending
· 12 DOM
Cashflow @ list (25.0% down · 7.5%)
Estimated rent
$1,307/mo
Mortgage (P&I)
−$839
Tax + insurance
−$426
HOA
−$0
Vac / Maint / Mgmt
−$274
Net cashflow
$-232/mo
Annual
$-2,782/yr
Cap rate
4.55%
Cash-on-cash
-6.21%
DSCR
0.72
1% rule
0.82%
Cash to close
$44,772
Investor read
- This is a 3-bed/2.0-bath single-family listed at $160k.
- At list price, monthly cash flow is $-232 ($-3k/yr) — negative.
- To cash-flow at today's rent, offer at most $119k (25.6% below list).
- To meet the 1% rule (rent ≥ 1% of price), the offer needs to be $131k (18.3% below list).
- Only 12 days on market — expect competitive offers; lowballing is unlikely to land.
- Recommended offer: $119k (25.6% below list) — sets the bar for cash-flow.
- In year one you build about $17k of equity ($1k loan paydown + $15k appreciation (9.7% local appreciation)).
- Location reads 55/100 on livability (#1,137 in NY) — a working-class tenant base; expect higher turnover. Strengths: cost of living A+, housing A+; Watch: schools F, crime F, amenities F.
- Central Square Central School District (suburban): math 40% / reading 40% proficiency, ranked #507 of 590 in NY (top 86%) — families likely to look elsewhere, expect single-tenant / working-renter base with shorter leases.
- Watch-outs: property tax is 2.7% of price.
- Market conditions: 11 active listings in the ZIP; 172 units permitted in Oswego County in 2024 (27 in 5+ unit buildings).
- Oswego County population projected at -23% by 2050 — secular population decline; favor cash flow + early exit over multi-decade hold.
- 7 sale attempts since 14y ago with the ask held roughly flat each time — persistent listings suggest the price (not the market) is what's stuck; bring a comps-based counter.
- Current owner paid $99k; list at $160k implies a 62% gain — meaningful room to come down on a strong offer.
- By year 3, paydown + projected appreciation supports a ~$42k cash-out refi (75% LTV) — recoverable capital for the next deal without selling this one.
- Cap rate 4.6% vs local median 3.1% in Cleveland — top-decile yield for the area; either an underpriced asset or a hidden risk that comps aren't pricing in. Stress-test before assuming the spread holds.
Questions for listing agent
- What do current leases actually rent for vs. the listed asking? Can we see a recent rent roll and the last 12 months of T-12 income?
- Property tax is high relative to price — has the assessment been appealed recently, and will the sale trigger a re-assessment?
- Is there a deadline driving the sale (1031 exchange, divorce, estate, relocation)? That informs how much negotiation room exists.
- Schools are F-rated, which usually means shorter tenancies and higher turnover. Who's the typical renter profile here, and what's been the actual vacancy rate?
- Crime grade is F in this area — have there been break-ins, vandalism, or insurance claims at this property in the last 3 years? What carrier currently insures it and at what premium?
- The area grade is low — what's the realistic commute time and amenity access for the typical tenant pool here? Any planned neighborhood developments (good or bad) we should know about?
- What's the average days-on-market for RENTAL listings here right now (not sales)? A rising rental-DOM trend means longer vacancies and softer asking-rent achievability than the comps imply.
- What's the recent tenant-quality profile in this submarket — average credit score on applications, eviction rate, late-payment / NSF rate, and stable-employment percentage? A property-management company in the area should have these aggregated.
CashFlowRE · CFR-XJ88TG3ZBY5XEP
· Data 1 week ago
cashflowre.app · 2026-05-29