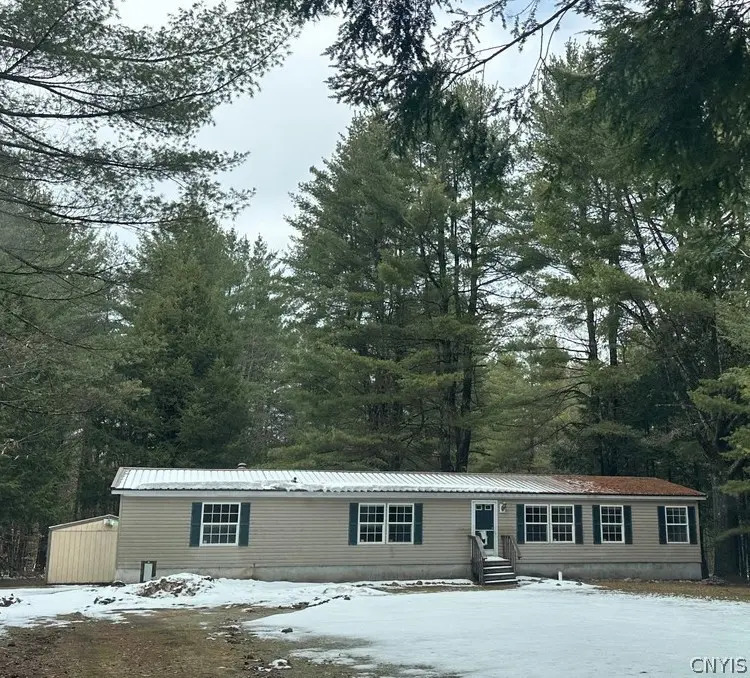
1085 County Route 17 · Cleveland, NY
Flood risk 1/10 · Minimal
- FEMA flood zone
- X (unshaded)
- Chance of flooding over 30 yrs
- 0.0%
- Est. flood insurance / yr
- $507 – $1,088
Fire risk 3/10 · Minor
- Est. fire insurance / yr
- $691 – $1,283
Heat risk 2/10 · Minimal
- Hot days now (above 93°F)
- 7 days/yr
- Hot days in 30 yrs
- 16 days/yr
Wind risk 1/10 · Minimal
- Chance of severe wind over 30 yrs
- —
Air-quality risk 2/10 · Minimal
- Unhealthy air days now
- 1 days/yr
- Unhealthy air days in 30 yrs
- 1 days/yr
Risk factors via First Street. Map © Google.
Why this score? — see what drove the D+ grade
The composite is a weighted blend of 9 inputs, each scored 0–100. Each bar is that input's sub-score; the figure is the points it added to the 100-point composite (weight × sub-score).
- ARV discount +15.0/15.0
- Appreciation +9.8/10.0
- Cash flow +7.0/30.0
- Schools +3.5/10.0
- 1% rule +3.2/10.0
- Livability +2.8/5.0
- Rent growth +2.5/5.0
- Condition / age +2.5/5.0
- DSCR +1.2/10.0
$159,900
🖨 Deal sheet (PDF) 📄 Offer letter ✓ Due diligence
Listing remarks MLS
Private treed setting, enjoy the view of your own point and tranquil surroundings. Spacious country sized kitchen, formal dining room, large livingroom, massive master bedroom with walk-in closet and full bath including garden tub and showing. 1,836 sq. ft. Generic Generator "all house".
Key facts
- Generous eating area
- Primary suite
- Large kitchen
Tags
Neighborhood map
What this means for you Summary
Snapshot
- This is a 3-bed/2.0-bath single-family listed at $160k.
Deal economics
- At list price, monthly cash flow is $-232 ($-3k/yr) — negative.
- To cash-flow at today's rent, offer at most $119k (25.6% below list).
- To meet the 1% rule (rent ≥ 1% of price), the offer needs to be $131k (18.3% below list).
- Recommended offer: $119k (25.6% below list) — sets the bar for cash-flow.
- Cap rate 4.6% vs local median 3.1% in Cleveland — top-decile yield for the area; either an underpriced asset or a hidden risk that comps aren't pricing in. Stress-test before assuming the spread holds.
Location & tenants
- Location reads 55/100 on livability (#1,137 in NY) — a working-class tenant base; expect higher turnover. Strengths: cost of living A+, housing A+; Watch: schools F, crime F, amenities F.
- Central Square Central School District (suburban): math 40% / reading 40% proficiency, ranked #507 of 590 in NY (top 86%) — families likely to look elsewhere, expect single-tenant / working-renter base with shorter leases.
- Market conditions: 11 active listings in the ZIP; 172 units permitted in Oswego County in 2024 (27 in 5+ unit buildings).
Forward outlook
- In year one you build about $17k of equity ($1k loan paydown + $15k appreciation (9.7% local appreciation)).
- Oswego County population projected at -23% by 2050 — secular population decline; favor cash flow + early exit over multi-decade hold.
- By year 3, paydown + projected appreciation supports a ~$42k cash-out refi (75% LTV) — recoverable capital for the next deal without selling this one.
Negotiation context
- Only 12 days on market — expect competitive offers; lowballing is unlikely to land.
- 7 sale attempts since 14y ago with the ask held roughly flat each time — persistent listings suggest the price (not the market) is what's stuck; bring a comps-based counter.
- Current owner paid $99k; list at $160k implies a 62% gain — meaningful room to come down on a strong offer.
Risks & watch-outs
- Watch-outs: property tax is 2.7% of price.
Questions for the listing agent
- What do current leases actually rent for vs. the listed asking? Can we see a recent rent roll and the last 12 months of T-12 income?
- Property tax is high relative to price — has the assessment been appealed recently, and will the sale trigger a re-assessment?
- Is there a deadline driving the sale (1031 exchange, divorce, estate, relocation)? That informs how much negotiation room exists.
- Schools are F-rated, which usually means shorter tenancies and higher turnover. Who's the typical renter profile here, and what's been the actual vacancy rate?
- Crime grade is F in this area — have there been break-ins, vandalism, or insurance claims at this property in the last 3 years? What carrier currently insures it and at what premium?
- The area grade is low — what's the realistic commute time and amenity access for the typical tenant pool here? Any planned neighborhood developments (good or bad) we should know about?
- What's the average days-on-market for RENTAL listings here right now (not sales)? A rising rental-DOM trend means longer vacancies and softer asking-rent achievability than the comps imply.
- What's the recent tenant-quality profile in this submarket — average credit score on applications, eviction rate, late-payment / NSF rate, and stable-employment percentage? A property-management company in the area should have these aggregated.
- How much new for-sale + rental construction is in the pipeline within 1–3 miles? Heavy new supply typically softens prices + rents 12–24 months out; constrained supply supports both.
Investment metrics
- 1% rule
- 0.82% ✗
- Cap rate
- 4.55%
- Cash-on-cash
- -6.21%
- DSCR
- 0.72
- GRM
- 10.2
CMA / ARV
- ARV (on-the-fly)
- $302,940
- Comps found
- 1
Show comp detail 1 sale within ~0.75 mi
| Address | Dist | Beds/Ba | Sqft | Sold | Price | $/sf | Match |
|---|---|---|---|---|---|---|---|
| 1037 County Route 17 | 0.29mi | 3/2.0 | 1,817 (-1%) | 9mo | $300,000 | $165 | 77 |
Match score weights: distance 35% · size 25% · config 20% · recency 20%. Top-matched comps best support the ARV.
Projected returns pro-forma
9.69% appreciation · 3.0% rent growth · sell at horizon
- IRR
- 19.2%
- Equity multiple
- 2.54×
- Total profit
- $69,066
- Equity at exit
- $140,465
- IRR
- 17.8%
- Equity multiple
- 5.79×
- Total profit
- $214,379
- Equity at exit
- $299,183
Cash invested: $44,772 (down + closing). Projections, not guarantees.
Landlord ↔ Tenant lean methodology
- Overall (STATE)
- 15 Strongly Tenant-Friendly
- State New York
- 15 Strongly Tenant-Friendly · D+10
- County
- — inherits STATE
- City
- — inherits STATE
ZIP-level market 13028
- Home prices YoY
- 3.3%
- Active inventory
- 11
- Price-to-rent
- 10.2×
Monthly cashflow live
- Estimated rent
- $1,307 medium interval (Pro) →
- Mortgage (P&I)
- −$839
- Tax from tax record
- −$359 /mo · $4,308/yr
- Insurance
- −$67
- HOA
- −$0
- Vacancy / Maint / Mgmt
- −$274
- Net cashflow
- $-232
Break-even live
Sensitivity live
| Price | -10% $-141 | -5% $-187 | +0% $-232 | +5% $-277 | +10% $-322 |
|---|---|---|---|---|---|
| Rent | -10% $-335 | -5% $-283 | +0% $-232 | +5% $-180 | +10% $-129 |
| Rate | -1.0pp $-151 | -0.5pp $-191 | base $-232 | +0.5pp $-273 | +1.0pp $-315 |
UW: 25.0% down · 7.5% · 30yr · 1.5% tax · 5.0% vac · 8.0% maint · 8.0% mgmt
Financing live
Cash to close
- Down payment
- $39,975
- Closing costs
- $4,797
- Reserves months
- —
- Total cash needed
- —
Loan-product check · same deal, 3 products live
Conventional
25% down · 7.5% · 30yr
- Down + closing
- —
- Monthly P&I
- —
- Monthly cashflow
- —
- DSCR
- —
- Eligible?
- —
Personal DTI + credit; lowest rate.
DSCR
20% down · 8.5% · 30yr
- Down + closing
- —
- Monthly P&I
- —
- Monthly cashflow
- —
- DSCR
- —
- Eligible?
- —
No personal income docs; deal must DSCR.
Hard money
10% down · 12.0% · 12mo
- Down + closing
- —
- Monthly P&I
- —
- Monthly cashflow
- —
- DSCR
- —
- Eligible?
- —
Short-term bridge; refi at stabilization.
Listing history 23 events
-
2026-04-09status Pending
-
2026-03-26$159,900 Active
-
2018-04-19soldstatus $99,000 Closed Sale or Rented 298-char remark
Show marketing remark (298 chars)
Private treed setting, enjoy the view of your own point and tranquil surroundings. Spacious country sized kitchen, formal dining room, large livingroom, massive master bedroom with walk-in closet and full bath including garden tub and showing. 1,836 sq. ft. Generic Generator "all house".
-
2018-04-18soldstatus $99,000
-
2018-03-06historical Continue to Show- Under Contract 298-char remark
Show marketing remark (298 chars)
Private treed setting, enjoy the view of your own point and tranquil surroundings. Spacious country sized kitchen, formal dining room, large livingroom, massive master bedroom with walk-in closet and full bath including garden tub and showing. 1,836 sq. ft. Generic Generator "all house".
-
2018-02-09$105,000 Active 298-char remark
Show marketing remark (298 chars)
Private treed setting, enjoy the view of your own point and tranquil surroundings. Spacious country sized kitchen, formal dining room, large livingroom, massive master bedroom with walk-in closet and full bath including garden tub and showing. 1,836 sq. ft. Generic Generator "all house".
-
2017-12-29status Under Contract- Do Not Show
-
2017-12-20historical
-
2017-12-20historical Continue to Show- Under Contract
-
2017-11-16status Active
-
2017-10-13historical Continue to Show- Under Contract
-
2017-09-19$99,900 Active
-
2017-09-18historical
-
2017-08-23price $99,900
-
2017-07-01$105,900 Active
-
2013-06-14soldstatus $95,000
-
2013-06-12soldstatus $95,000
-
2013-01-08$99,900
-
2012-07-05$99,900
-
2009-07-01soldstatus $89,900
-
2005-03-25soldstatus $82,000
-
2001-02-07soldstatus $72,250
-
1996-10-21soldstatus $95,000
ⓘ Source: listings_history table (triggers on properties + properties_extension) + one-shot
backfill from property_details.listing_events for pre-trigger history.
Tax reassessment forecast NY · Partial reset (capped growth)
- Current annual tax
- $4,308 · $359/mo
- Projected year-2 tax
- $4,308 · $359/mo
- Expected delta
- $0/yr ($0/mo · 0.0%)
ⓘ Screening estimate from a state-policy table — verify with the county assessor before closing.
Climate risk First Street
- Flood 1/10 Low FEMA zone X (unshaded) · 0% chance over 30 yrs
- Wildfire 3/10 Moderate
- Heat 2/10 Low 7 d/yr ≥93°F today · 16 d/yr by 30 yrs out
- Wind 1/10 Low
- Air quality 2/10 Low 1 unhealthy d/yr today · 1 by 30 yrs out
Nearby sold comps map
Loading sold comps map…
Walkable amenities ~0.75 mi
Loading nearby amenities…
Taxation est. · year 1
- Rental income
- $15,681
- − Mortgage interest
- −$8,957
- − Property taxes
- −$4,308
- − Insurance
- −$800
- − Repairs & maintenance
- −$1,254
- − Management
- −$1,254
- − Depreciation
- −$4,652
- Taxable loss
- −$5,544
- Est. tax savings @ 24.0%
- +$1,331
- After-tax cash flow
- $-1,452/yr
For passive investors: Depreciation is non-cash, so a rental often shows a tax loss while cash-flowing — sheltering income. Rental losses are passive: they offset passive income freely, and up to $25,000/yr can offset ordinary (W-2) income if you actively participate and your MAGI is under $100k (phasing out to $0 by $150k); unused losses carry forward. On sale, claimed depreciation is recaptured at up to 25%, and gains may owe capital-gains tax (a 1031 exchange can defer both). Figures are a year-1 estimate at your 24.0% rate — not tax advice; consult a CPA.
Schools (NCES district)
- District
- Central Square Central School District
- NCES district ID
- 3606900
- Math proficiency
- 40% ▼ -18.00%
- Reading proficiency
- 40% ▼ -12.00%
- Median HH income
- $55,807
- Composite
- 35.05/100
- National rank
- #5035
- State rank
- #507 of 590 in NY
Livability — Cleveland
- Score
- 55/100
- State rank
- #1137
- US rank
- #23552
Category grades
Schools grade is shown separately in the Schools card above.
Census & demographics
- Population (ZIP)
- 913
Population outlook (Oswego County) Hauer SSP2
- Today (2025)
- 114,465 people
- By 2030
- 109,968 · -3.9%
- By 2040
- 99,205 · -13.3%
- By 2050
- 87,979 · -23.1%
- By 2075
- 65,100 · -43.1%
- By 2100
- 47,117 · -58.8%
Race, ethnicity, and origin ACS 2023
- Neighborhood character
- Predominantly White (93%)
- Race & ethnicity
- White 93% Two or more races 7% Hispanic / Latino 4%
- Common ancestry
- Italian 4% Slovak 3% Romanian 3%
- Foreign-born
- 2%
Political lean MEDSL · Oswego
- 2024 margin
- Strong R (+24.2) · D 37.9% · R 62.1%
- 2008→2024 swing
- -26.6pp toward R · 2008: 2.5pp · 2024: -24.2pp
- All cycles
- 2024: R+24.2 2020: R+20.2 2016: R+23.2 2012: D+7.9 2008: D+2.5
Not yet ingested
- Civics
- —
Market trends
- HPI YoY
- ▲ 9.69%
- Current HPI
- 303.5003
- Rent YoY
- —
- Metro
- —
- State GDP YoY
- ▲ 2.60%
- F500 in state
- 92
Industry mix (Fortune 500 HQ in NY)
| Industry | F500 HQs | Revenue |
|---|---|---|
| Financial Services | 10 | $950B |
|
||
| Consumer Goods | 9 | $162B |
|
||
| Insurance | 4 | $225B |
|
||
| Telecommunications | 2 | $144B |
|
||
| Pharmaceuticals | 2 | $112B |
|
||
| Media / Entertainment | 2 | $69B |
|
||
Price history
+68.3% since first listed23 events — show timeline
- 2026-04-09 Pending — CNYIS
- 2026-03-26 Listed $159,900 CNYIS
- 2018-04-19 Sold (MLS) $99,000 CNYIS
- 2018-04-18 Sold (Public Records) $99,000 Public Records
- 2018-03-06 Contingent — CNYIS
- 2018-02-09 Listed $105,000 CNYIS
- 2017-12-29 Pending — CNYIS
- 2017-12-20 Listing Removed — CNYIS
- 2017-12-20 Contingent — CNYIS
- 2017-11-16 Relisted — CNYIS
- 2017-10-13 Contingent — CNYIS
- 2017-09-19 Listed $99,900 CNYIS
- 2017-09-18 Listing Removed — CNYIS
- 2017-08-23 Price Changed $99,900 CNYIS
- 2017-07-01 Listed $105,900 CNYIS
- 2013-06-14 Sold (Public Records) $95,000 Public Records
- 2013-06-12 Sold (MLS) $95,000 CNYIS
- 2013-01-08 Listed $99,900 CNYIS
- 2012-07-05 Listed $99,900 CNYIS
- 2009-07-01 Sold (Public Records) $89,900 Public Records
- 2005-03-25 Sold (Public Records) $82,000 Public Records
- 2001-02-07 Sold (Public Records) $72,250 Public Records
- 1996-10-21 Sold (Public Records) $95,000 Public Records
Property tax history
+2.8%/yrLatest (2025): $4,308 · +1.1% YoY. Source: county tax records.
Cash-flow waterfall
monthlySold comps — $/sqft
last 12 mo · ≤1 miLoading sold comps…