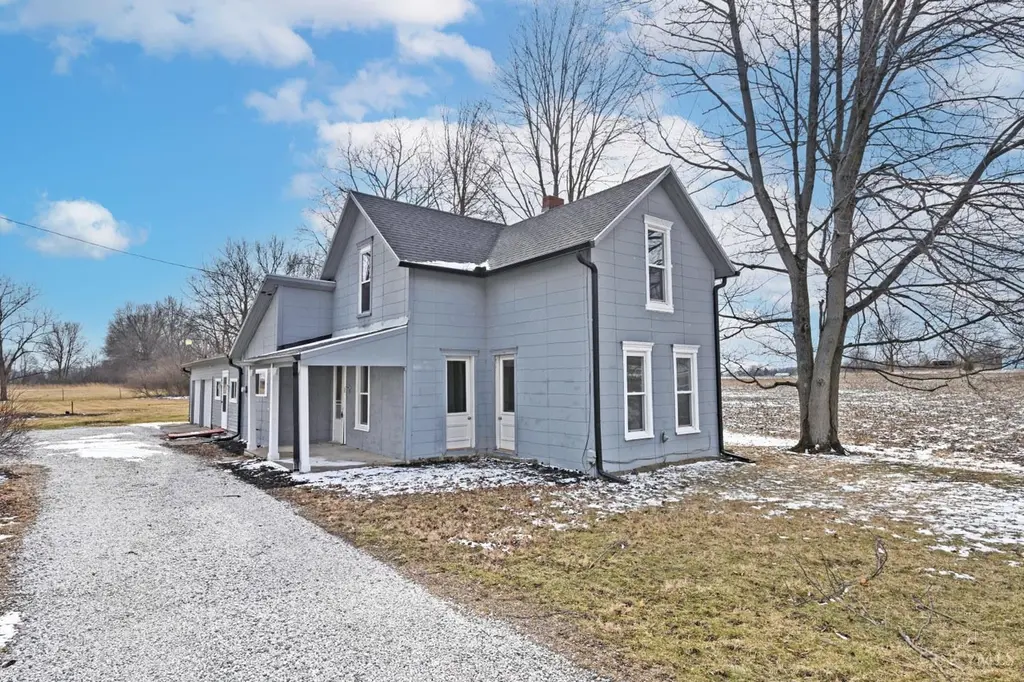
8528 E US Rt 36
St. Paris, OH 45317
$169,900D+
3 bd · 1.0 ba ·
1,401 sqft ·
Built 1920
· SingleFamily
· Active
· 4 DOM
Cashflow @ list (25.0% down · 7.5%)
Estimated rent
$1,202/mo
Mortgage (P&I)
−$891
Tax + insurance
−$243
HOA
−$0
Vac / Maint / Mgmt
−$252
Net cashflow
$-185/mo
Annual
$-2,216/yr
Cap rate
5.87%
Cash-on-cash
-1.50%
DSCR
0.93
1% rule
0.71%
Cash to close
$47,572
Investor read
- This is a 3-bed/1.0-bath single-family listed at $170k.
- At list price, monthly cash flow is $-185 ($-2k/yr) — negative.
- To cash-flow at today's rent, offer at most $137k (19.2% below list).
- To meet the 1% rule (rent ≥ 1% of price), the offer needs to be $120k (29.3% below list).
- Only 4 days on market — expect competitive offers; lowballing is unlikely to land.
- Recommended offer: $120k (29.3% below list) — sets the bar for 1% rule.
- In year one you build about $10k of equity ($1k loan paydown + $9k appreciation (5.2% local appreciation)).
- Location reads: area grade D — affects rentability + tenant quality, not the cash-flow math above.
- Miami East Local (rural): math 75% / reading 79% proficiency, ranked #70 of 656 in OH (top 11%) — strong family-tenant draw, lease renewals of 3-5y typical.
- Watch-outs: flood insurance adds $125/mo; built in 1920 — expect roof / HVAC / electrical / plumbing capex.
- Market conditions: 1 active listings in the ZIP; solid renter incomes; 326 units permitted in Miami County in 2024 (0 in 5+ unit buildings).
- 6 sale attempts; this cycle's ask has dropped $10k (6%) from the opening price — seller is motivated, your offer sets the floor, not the list.
- Current owner paid $45k; list at $170k implies a 278% gain — meaningful room to come down on a strong offer.
- By year 4, paydown + projected appreciation supports a ~$34k cash-out refi (75% LTV) — recoverable capital for the next deal without selling this one.
- Climate carrying-cost: in FEMA flood zone A (mandatory federal flood insurance) — expect insurance premiums to compound above CPI over the hold.
- This rent is only 14% of the median local income ($101k/yr) — well below the 30% rent-burden line; pricing power to push rent on renewal without tenant pushback.
Questions for listing agent
- What do current leases actually rent for vs. the listed asking? Can we see a recent rent roll and the last 12 months of T-12 income?
- Built in 1920 — when were the roof, HVAC, electrical panel, plumbing, and water heater last replaced?
- What's the actual annual flood-insurance premium (NFIP or private), and is the property in a SFHA with mandatory coverage?
- Is there a deadline driving the sale (1031 exchange, divorce, estate, relocation)? That informs how much negotiation room exists.
- The area grade is low — what's the realistic commute time and amenity access for the typical tenant pool here? Any planned neighborhood developments (good or bad) we should know about?
- What's the average days-on-market for RENTAL listings here right now (not sales)? A rising rental-DOM trend means longer vacancies and softer asking-rent achievability than the comps imply.
- What's the recent tenant-quality profile in this submarket — average credit score on applications, eviction rate, late-payment / NSF rate, and stable-employment percentage? A property-management company in the area should have these aggregated.
- How much new for-sale + rental construction is in the pipeline within 1–3 miles? Heavy new supply typically softens prices + rents 12–24 months out; constrained supply supports both.
CashFlowRE · CFR-XMM3KN8TCHFX48
· Data 5 days ago
cashflowre.app · 2026-05-29