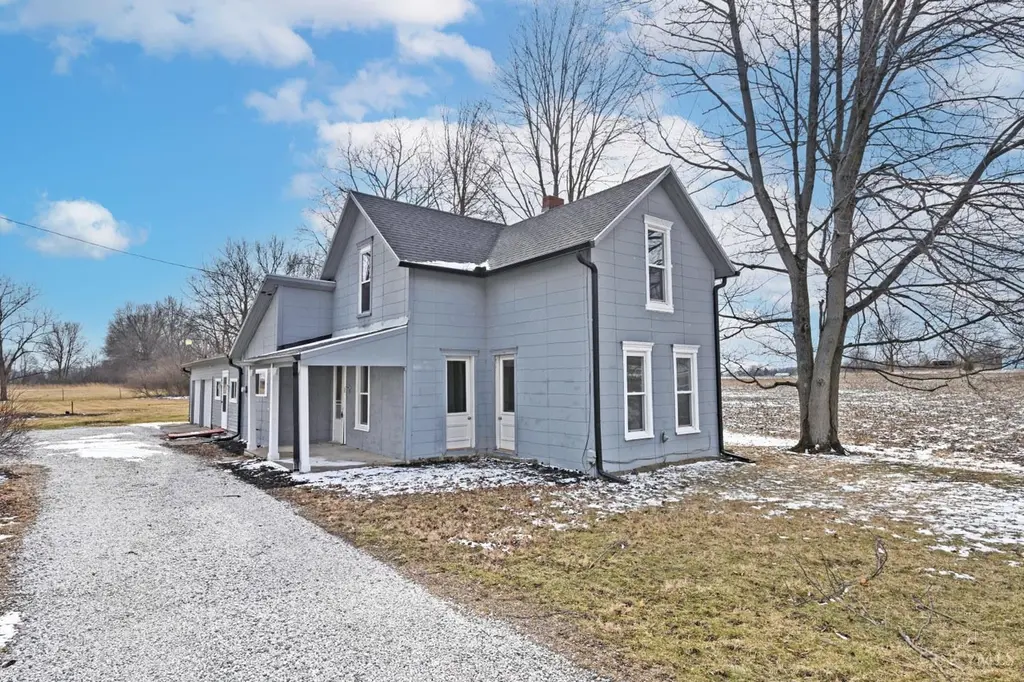
8528 E US Rt 36 · St. Paris, OH
Flood risk 8/10 · Major
- FEMA flood zone
- A
- Chance of flooding over 30 yrs
- 0.99%
- Est. flood insurance / yr
- $1,009 – $1,996
Fire risk 1/10 · Minimal
- Est. fire insurance / yr
- $713 – $1,323
Heat risk 3/10 · Minor
- Hot days now (above 98°F)
- 7 days/yr
- Hot days in 30 yrs
- 18 days/yr
Wind risk 2/10 · Minimal
- Chance of severe wind over 30 yrs
- 0.0%
Air-quality risk 3/10 · Minor
- Unhealthy air days now
- 2 days/yr
- Unhealthy air days in 30 yrs
- 3 days/yr
Risk factors via First Street. Map © Google.
Why this score? — see what drove the D+ grade
The composite is a weighted blend of 9 inputs, each scored 0–100. Each bar is that input's sub-score; the figure is the points it added to the 100-point composite (weight × sub-score).
- Cash flow +11.4/30.0
- Appreciation +7.6/10.0
- ARV discount +7.5/15.0
- Schools +6.6/10.0
- DSCR +3.3/10.0
- Rent growth +2.5/5.0
- Livability +2.5/5.0
- Condition / age +2.5/5.0
- 1% rule +2.1/10.0
$169,900
🖨 Deal sheet 📄 Offer letter ✓ Due diligence
Listing remarks MLS
Look no further than this beautifully renovated home with all new kitchen complete with new cabinets, countertops and stainless-steel appliances. All new bathroom with wall to ceiling tile. New flooring, paint, fixtures, HVAC wall units in rooms with individual remotes for zone heating/cooling, and newer windows. 2 bedrooms on the 1st floor and a sitting room plus 2 more bedrooms upstairs. 2 car attached garage plus plenty of parking in the stone driveway. Enjoy a quiet sitting area in the enclosed porch between the home and garage.
Key facts
- New kitchen
- New bathroom
- New flooring
Tags
Property features AI
Finance
- HOA & community: No HOA
Exterior
- Parking: Attached garage with 2 garage spaces; Gravel parking
- Utilities: Well water; Septic tank; Electric water heater
- Home design: Historical architectural style; Single-family home; Two levels; Primary walkout entry
- Construction: Shingle roof; Shingle siding; Block foundation; Second floor area noted
- Exterior features: Vinyl windows; Residential zoning
Interior
- Kitchen: Solid surface countertops; Wood cabinets; Dishwasher; Oven/Range; Refrigerator
- Bedrooms: 4 bedrooms (primary features a walkout); Primary bedroom approximately 11 x 12 (level 1); Bedroom 2 approximately 11 x 12 (level 1); Bedroom 3 approximately 11 x 12 (level 2); Bedroom 4 approximately 13 x 14 (level 2)
- Bathrooms: 1 full bathroom on level 1
- Heating & cooling: Ductless heating; Ductless cooling
- Interior features: Walkout living room; Total of 8 rooms
- Laundry & utility: Laundry room approximately 9 x 12 (level 1)
Neighborhood map
What this means for you Summary
Snapshot
- This is a 3-bed/1.0-bath single-family listed at $170k.
Deal economics
- At list price, monthly cash flow is $-185 ($-2k/yr) — negative.
- To cash-flow at today's rent, offer at most $137k (19.2% below list).
- To meet the 1% rule (rent ≥ 1% of price), the offer needs to be $120k (29.3% below list).
- Recommended offer: $120k (29.3% below list) — sets the bar for 1% rule.
Location & tenants
- Location reads: area grade D — affects rentability + tenant quality, not the cash-flow math above.
- Miami East Local (rural): math 75% / reading 79% proficiency, ranked #70 of 656 in OH (top 11%) — strong family-tenant draw, lease renewals of 3-5y typical.
- Market conditions: 1 active listings in the ZIP; solid renter incomes; 326 units permitted in Miami County in 2024 (0 in 5+ unit buildings).
- This rent is only 14% of the median local income ($101k/yr) — well below the 30% rent-burden line; pricing power to push rent on renewal without tenant pushback.
Forward outlook
- In year one you build about $10k of equity ($1k loan paydown + $9k appreciation (5.2% local appreciation)).
- By year 4, paydown + projected appreciation supports a ~$34k cash-out refi (75% LTV) — recoverable capital for the next deal without selling this one.
Negotiation context
- Only 4 days on market — expect competitive offers; lowballing is unlikely to land.
- 6 sale attempts; this cycle's ask has dropped $10k (6%) from the opening price — seller is motivated, your offer sets the floor, not the list.
- Current owner paid $45k; list at $170k implies a 278% gain — meaningful room to come down on a strong offer.
Risks & watch-outs
- Watch-outs: flood insurance adds $125/mo; built in 1920 — expect roof / HVAC / electrical / plumbing capex.
- Climate carrying-cost: in FEMA flood zone A (mandatory federal flood insurance) — expect insurance premiums to compound above CPI over the hold.
Questions for the listing agent
- What do current leases actually rent for vs. the listed asking? Can we see a recent rent roll and the last 12 months of T-12 income?
- Built in 1920 — when were the roof, HVAC, electrical panel, plumbing, and water heater last replaced?
- What's the actual annual flood-insurance premium (NFIP or private), and is the property in a SFHA with mandatory coverage?
- Is there a deadline driving the sale (1031 exchange, divorce, estate, relocation)? That informs how much negotiation room exists.
- The area grade is low — what's the realistic commute time and amenity access for the typical tenant pool here? Any planned neighborhood developments (good or bad) we should know about?
- What's the average days-on-market for RENTAL listings here right now (not sales)? A rising rental-DOM trend means longer vacancies and softer asking-rent achievability than the comps imply.
- What's the recent tenant-quality profile in this submarket — average credit score on applications, eviction rate, late-payment / NSF rate, and stable-employment percentage? A property-management company in the area should have these aggregated.
- How much new for-sale + rental construction is in the pipeline within 1–3 miles? Heavy new supply typically softens prices + rents 12–24 months out; constrained supply supports both.
Investment metrics
- 1% rule
- 0.71% ✗
- Cap rate
- 5.87%
- Cash-on-cash
- -1.50%
- DSCR
- 0.93
- GRM
- 11.8
CMA / ARV
No comps found within radius.
Projected returns pro-forma
5.25% appreciation · 3.0% rent growth · sell at horizon
- IRR
- 9.6%
- Equity multiple
- 1.63×
- Total profit
- $29,798
- Equity at exit
- $98,840
- IRR
- 11.1%
- Equity multiple
- 3.08×
- Total profit
- $99,174
- Equity at exit
- $172,738
Cash invested: $47,572 (down + closing). Projections, not guarantees.
Landlord ↔ Tenant lean methodology
- Overall (STATE)
- 73 Landlord-Friendly
- State Ohio
- 73 Landlord-Friendly · R+6
- County
- — inherits STATE
- City
- — inherits STATE
ZIP-level market 45317
- Home prices YoY
- 2.0%
- Active inventory
- 1
- Price-to-rent
- 11.8×
Monthly cashflow live
- Estimated rent
- $1,202 medium interval (Pro) →
- Mortgage (P&I)
- −$891
- Tax from tax record
- −$47 /mo · $564/yr
- Insurance
- −$71
- Flood insurance flood zone
- −$125 /mo · $1,502/yr
- HOA
- −$0
- Vacancy / Maint / Mgmt
- −$252
- Net cashflow
- $-185
Break-even live
UW: 25.0% down · 7.5% · 30yr · 1.5% tax · 5.0% vac · 8.0% maint · 8.0% mgmt
Financing live
Cash to close
- Down payment
- $42,475
- Closing costs
- $5,097
- Reserves months
- —
- Total cash needed
- —
Loan-product check · same deal, 3 products live
Conventional
25% down · 7.5% · 30yr
- Down + closing
- —
- Monthly P&I
- —
- Monthly cashflow
- —
- DSCR
- —
- Eligible?
- —
Personal DTI + credit; lowest rate.
DSCR
20% down · 8.5% · 30yr
- Down + closing
- —
- Monthly P&I
- —
- Monthly cashflow
- —
- DSCR
- —
- Eligible?
- —
No personal income docs; deal must DSCR.
Hard money
10% down · 12.0% · 12mo
- Down + closing
- —
- Monthly P&I
- —
- Monthly cashflow
- —
- DSCR
- —
- Eligible?
- —
Short-term bridge; refi at stabilization.
Listing history 18 events
-
2026-06-15days on market $169,900 Active 4 DOM
-
2026-06-14days on market $169,900 Active 2 DOM
-
2026-06-13price $169,900 Active 1 DOM
-
2026-05-29historical
-
2026-05-28$179,900 Active
Show marketing remark (538 chars)
Look no further than this beautifully renovated home with all new kitchen complete with new cabinets, countertops and stainless-steel appliances. All new bathroom with wall to ceiling tile. New flooring, paint, fixtures, HVAC wall units in rooms with individual remotes for zone heating/cooling, and newer windows. 2 bedrooms on the 1st floor and a sitting room plus 2 more bedrooms upstairs. 2 car attached garage plus plenty of parking in the stone driveway. Enjoy a quiet sitting area in the enclosed porch between the home and garage.
-
2026-05-28$179,900 Active 538-char remark
Show marketing remark (538 chars)
Look no further than this beautifully renovated home with all new kitchen complete with new cabinets, countertops and stainless-steel appliances. All new bathroom with wall to ceiling tile. New flooring, paint, fixtures, HVAC wall units in rooms with individual remotes for zone heating/cooling, and newer windows. 2 bedrooms on the 1st floor and a sitting room plus 2 more bedrooms upstairs. 2 car attached garage plus plenty of parking in the stone driveway. Enjoy a quiet sitting area in the enclosed porch between the home and garage.
-
2026-03-30historical
-
2026-03-30historical
-
2026-03-19historical ActiveUnderContract
-
2026-03-19historical Contingency Pending
-
2026-03-11status Active
-
2026-03-11status Active
-
2026-03-02historical ActiveUnderContract
-
2026-03-02historical Contingency Pending
-
2026-02-26$199,900 Active
-
2026-02-26$199,900 Active
-
2025-09-23soldstatus $45,000
-
1984-04-01soldstatus $20,000
ⓘ Source: listings_history table (triggers on properties + properties_extension) + one-shot
backfill from property_details.listing_events for pre-trigger history.
Tax reassessment forecast OH · Partial reset (capped growth)
- Current annual tax
- $564 · $47/mo
- Projected year-2 tax
- $1,607 · $134/mo
- Expected delta
- +$1,043/yr (+$87/mo · 184.9%)
ⓘ Screening estimate from a state-policy table — verify with the county assessor before closing.
Climate risk First Street
- Flood 8/10 Severe FEMA zone A · 99% chance over 30 yrs
- Wildfire 1/10 Low
- Heat 3/10 Moderate 7 d/yr ≥98°F today · 18 d/yr by 30 yrs out
- Wind 2/10 Low 0% chance of damaging wind over 30 yrs
- Air quality 3/10 Moderate 2 unhealthy d/yr today · 3 by 30 yrs out
Nearby sold comps map
Loading sold comps map…
Walkable amenities ~0.75 mi
Loading nearby amenities…
Taxation est. · year 1
- Rental income
- $14,420
- − Mortgage interest
- −$9,517
- − Property taxes
- −$564
- − Insurance
- −$2,352
- − Repairs & maintenance
- −$1,154
- − Management
- −$1,154
- − Depreciation
- −$4,943
- Taxable loss
- −$5,263
- Est. tax savings @ 24.0%
- +$1,263
- After-tax cash flow
- $-953/yr
For passive investors: Depreciation is non-cash, so a rental often shows a tax loss while cash-flowing — sheltering income. Rental losses are passive: they offset passive income freely, and up to $25,000/yr can offset ordinary (W-2) income if you actively participate and your MAGI is under $100k (phasing out to $0 by $150k); unused losses carry forward. On sale, claimed depreciation is recaptured at up to 25%, and gains may owe capital-gains tax (a 1031 exchange can defer both). Figures are a year-1 estimate at your 24.0% rate — not tax advice; consult a CPA.
Schools (NCES district)
- District
- Miami East Local
- NCES district ID
- 3904862
- Math proficiency
- 75% ▼ -9.00%
- Reading proficiency
- 79% ▼ -3.00%
- Median HH income
- $62,317
- Composite
- 66.34/100
- National rank
- #424
- State rank
- #70 of 656 in OH
Livability — St. Paris
No livability data for this city. (Only ~50 U.S. cities are tracked.)
Census & demographics
- County
- Champaign · 37,359 people
- Population (ZIP)
- 838
- Household income
- $101,023
- Rent vs Own
Population outlook (Miami County) Hauer SSP2
- Today (2025)
- 107,816 people
- By 2030
- 108,896 · +1.0%
- By 2040
- 109,581 · +1.6%
- By 2050
- 108,110 · +0.3%
- By 2075
- 101,523 · -5.8%
- By 2100
- 85,787 · -20.4%
Race, ethnicity, and origin ACS 2023
- Neighborhood character
- Predominantly White (94%)
- Race & ethnicity
- White 94% Hispanic / Latino 6% Two or more races 5%
- Hispanic origin (detail)
- Mexican 6%
- Common ancestry
- Italian 12% Lithuanian 1% Slovak 1%
Political lean MEDSL · Miami
- 2024 margin
- Solid R (+45.1) · D 27.0% · R 72.1%
- 2008→2024 swing
- -16.6pp toward R · 2008: -28.5pp · 2024: -45.1pp
- All cycles
- 2024: R+45.1 2020: R+44.3 2016: R+45.6 2012: R+35.6 2008: R+28.5
Not yet ingested
- Civics
- —
Market trends
- HPI YoY
- ▲ 5.25%
- Current HPI
- 264.4125
- Rent YoY
- —
- Metro
- —
- State GDP YoY
- ▲ 1.98%
- F500 in state
- 48
Industry mix (Fortune 500 HQ in OH)
| Industry | F500 HQs | Revenue |
|---|---|---|
| Insurance | 3 | $145B |
|
||
| Industrial Machinery | 3 | $49B |
|
||
| Financial Services | 3 | $24B |
|
||
| Consumer Goods | 2 | $93B |
|
||
| Aerospace / Defense | 2 | $47B |
|
||
| Utilities | 2 | $33B |
|
||
Price history
+799.5% since first listed15 events — show timeline
- 2026-05-29 Listing Removed — Cincy MLS
- 2026-05-28 Listed $179,900 Dayton MLS
- 2026-05-28 Listed $179,900 Cincy MLS
- 2026-03-30 Listing Removed — Dayton MLS
- 2026-03-30 Listing Removed — Cincy MLS
- 2026-03-19 Contingent — Dayton MLS
- 2026-03-19 Contingent — Cincy MLS
- 2026-03-11 Relisted — Dayton MLS
- 2026-03-11 Relisted — Cincy MLS
- 2026-03-02 Contingent — Dayton MLS
- 2026-03-02 Contingent — Cincy MLS
- 2026-02-26 Listed $199,900 Dayton MLS
- 2026-02-26 Listed $199,900 Cincy MLS
- 2025-09-23 Sold (Public Records) $45,000 Public Records
- 1984-04-01 Sold (Public Records) $20,000 Public Records
Property tax history
+3.4%/yrLatest (2025): $564 · +2.2% YoY. Source: county tax records.
Cash-flow waterfall
monthlySold comps — $/sqft
last 12 mo · ≤1 miLoading sold comps…