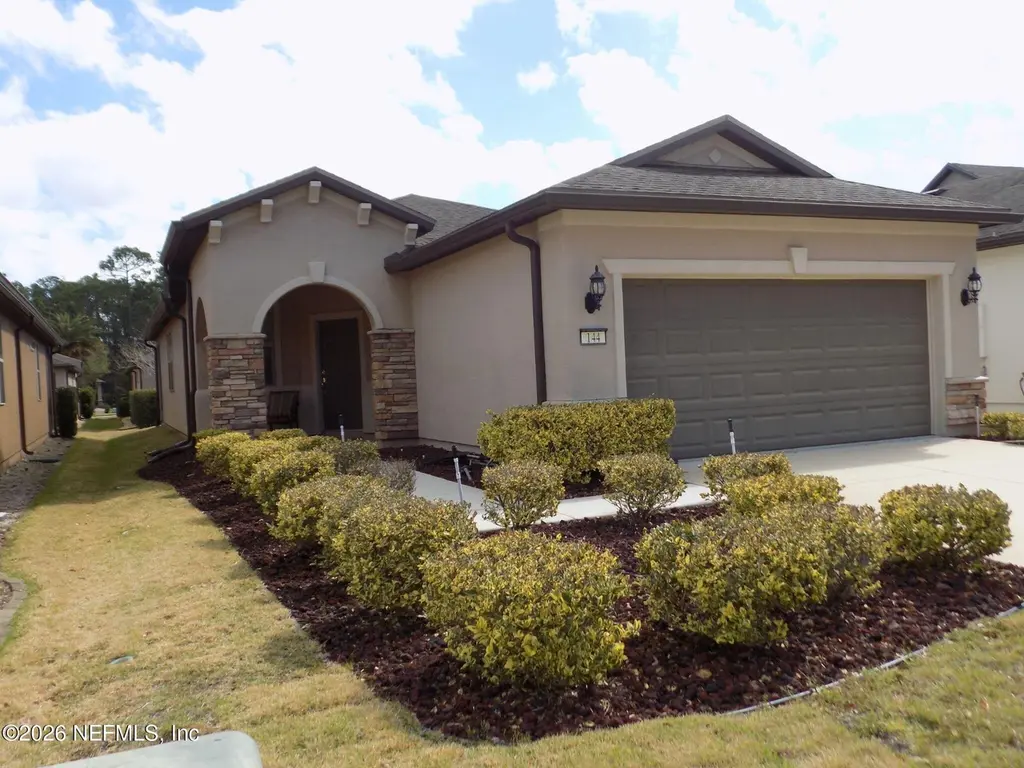
144 Goldenrod Park Rd
Nocatee, FL 32081
$411,000D-
2 bd · 2.0 ba ·
1,348 sqft ·
Built 2016
· SingleFamily
· Active
· 150 DOM
Cashflow @ list (25.0% down · 7.5%)
Estimated rent
$2,498/mo
Mortgage (P&I)
−$2,155
Tax + insurance
−$410
HOA
−$245
Vac / Maint / Mgmt
−$525
Net cashflow
$-836/mo
Annual
$-10,037/yr
Cap rate
3.85%
Cash-on-cash
-8.72%
DSCR
0.61
1% rule
0.61%
Cash to close
$115,080
Investor read
- This is a 2-bed/2.0-bath single-family listed at $411k.
- At list price, monthly cash flow is $-836 ($-10k/yr) — negative.
- To cash-flow at today's rent, offer at most $263k (36.0% below list).
- To meet the 1% rule (rent ≥ 1% of price), the offer needs to be $250k (39.2% below list).
- It's been on market 150 days — a 12% lower offer ($362k) is reasonable based on typical stale-listing flexibility.
- Recommended offer: $250k (39.2% below list) — sets the bar for 1% rule.
- In year one you build about $832 of equity ($3k loan paydown + $-2k appreciation (-0.5% local appreciation)).
- Location reads 70/100 on livability (#425 in FL) — a middle-class / working-renter tenant base. Strengths: schools A+, crime A+, employment A+; Watch: amenities F, commute F, cost of living F.
- St. Johns (rural): math 75% / reading 73% proficiency, ranked #2 of 73 in FL (top 3%) — strong family-tenant draw, lease renewals of 3-5y typical; only 20% free/reduced lunch — higher-income household profile.
- Market conditions: Rents rising (+1.1%/yr); 652 active listings in the ZIP; 2 comparable units currently listed for rent nearby; high-income renter base; 5,575 units permitted in St. Johns County in 2024 (584 in 5+ unit buildings).
- St. Johns County population projected at +60% by 2050 — long-run rental-demand tailwind backs the buy-and-hold thesis.
- 2 sale attempts since 10y ago with the ask held roughly flat each time — persistent listings suggest the price (not the market) is what's stuck; bring a comps-based counter.
- Current owner paid $234k; list at $411k implies a 76% gain — meaningful room to come down on a strong offer.
- Climate carrying-cost: severe wind risk, 99% chance of damaging wind over 30y; major wildfire risk; extreme-heat days projected 7→21/yr by 2055 (HVAC capex compounding) — expect insurance premiums to compound above CPI over the hold.
- Cap rate 3.9% vs local median 2.5% in Nocatee — top-decile yield for the area; either an underpriced asset or a hidden risk that comps aren't pricing in. Stress-test before assuming the spread holds.
Questions for listing agent
- What do current leases actually rent for vs. the listed asking? Can we see a recent rent roll and the last 12 months of T-12 income?
- It's been on market 150 days. Have you received any prior offers? Is the seller open to a 39% concession, seller financing, or rate buy-down credit?
- What does the HOA fee cover, when was the last increase, and are there any pending special assessments or reserve-fund shortfalls?
- Why hasn't it sold? Are there any deal-killer items the seller is aware of (foundation, flood, title, zoning, code violations)?
- Is there a deadline driving the sale (1031 exchange, divorce, estate, relocation)? That informs how much negotiation room exists.
- Schools are A-rated — typically a magnet for longer-tenancy family renters. What's the average tenant stay here, and is there a school-zone premium baked into asking?
- The area grade is low — what's the realistic commute time and amenity access for the typical tenant pool here? Any planned neighborhood developments (good or bad) we should know about?
- What's the average days-on-market for RENTAL listings here right now (not sales)? A rising rental-DOM trend means longer vacancies and softer asking-rent achievability than the comps imply.
CashFlowRE · CFR-XMPDJFDT3PFFD1
· Data 2 days ago
cashflowre.app · 2026-05-29