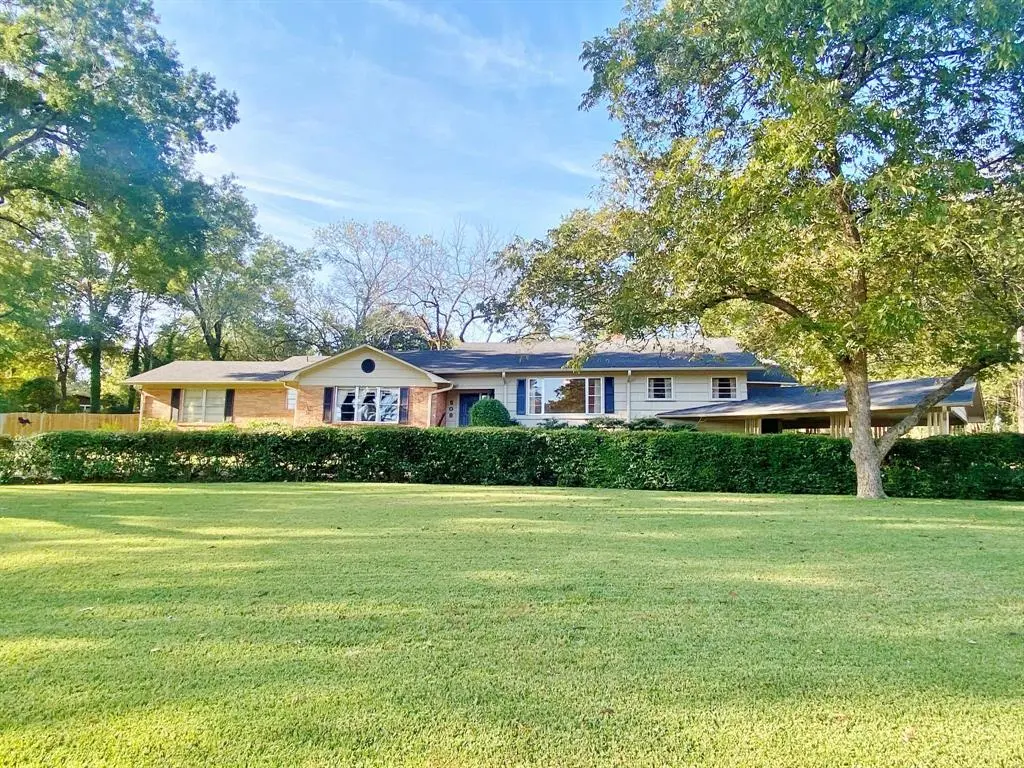
508 Dellwood
Mount Pleasant, TX 75455
$249,000D
3 bd · 2.0 ba ·
2,852 sqft ·
Built 1955
· SingleFamily
· Active
· 53 DOM
Cashflow @ list (25.0% down · 7.5%)
Estimated rent
$2,072/mo
Mortgage (P&I)
−$1,306
Tax + insurance
−$520
HOA
−$0
Vac / Maint / Mgmt
−$435
Net cashflow
$-189/mo
Annual
$-2,265/yr
Cap rate
5.38%
Cash-on-cash
-3.25%
DSCR
0.86
1% rule
0.83%
Cash to close
$69,720
Investor read
- This is a 3-bed/2.0-bath single-family listed at $249k.
- At list price, monthly cash flow is $-189 ($-2k/yr) — negative.
- To cash-flow at today's rent, offer at most $216k (13.4% below list).
- To meet the 1% rule (rent ≥ 1% of price), the offer needs to be $207k (16.8% below list).
- It's been on market 53 days — a 3% lower offer ($242k) is reasonable based on typical stale-listing flexibility.
- Recommended offer: $207k (16.8% below list) — sets the bar for 1% rule.
- Local home prices are declining (-3.0%/yr); year-one equity from $2k of loan paydown is wiped out by about $7k of value loss. Plan a longer hold.
- Location reads 77/100 on livability (#81 in TX, #2,808 nationally) — a middle-class / working-renter tenant base. Strengths: cost of living A+, housing A+, health & safety A+; Watch: employment C-, amenities D-, commute F.
- Mount Pleasant ISD (town): math 45% / reading 44% proficiency, ranked #291 of 826 in TX (top 35%) — families likely to look elsewhere, expect single-tenant / working-renter base with shorter leases; 74% free/reduced lunch — lower-income household profile, screen leases tightly.
- Zoned schools: E C Brice El (math 47% / reading 52%, grade D, #865 of 4,322 statewide, top 21%, 460 students, 80% FRL).
- Watch-outs: built in 1955 — expect roof / HVAC / electrical / plumbing capex.
- Market conditions: 382 active listings in the ZIP; 2 comparable units currently listed for rent nearby; 47 units permitted in Titus County in 2024 (10 in 5+ unit buildings).
- 7 sale attempts since 2y ago with the ask held roughly flat each time — persistent listings suggest the price (not the market) is what's stuck; bring a comps-based counter.
- Climate carrying-cost: major wind risk, 27% chance of damaging wind over 30y; moderate wildfire risk; extreme-heat days projected 7→23/yr by 2055 (HVAC capex compounding) — expect insurance premiums to compound above CPI over the hold.
- Cap rate 5.4% vs local median 3.5% in Mount Pleasant — top-decile yield for the area; either an underpriced asset or a hidden risk that comps aren't pricing in. Stress-test before assuming the spread holds.
- This rent runs 44% of the median local income ($56k/yr) — at the standard rent-burdened threshold; future hikes will face affordability resistance.
Questions for listing agent
- What do current leases actually rent for vs. the listed asking? Can we see a recent rent roll and the last 12 months of T-12 income?
- It's been on market 53 days. Have you received any prior offers? Is the seller open to a 17% concession, seller financing, or rate buy-down credit?
- Built in 1955 — when were the roof, HVAC, electrical panel, plumbing, and water heater last replaced?
- Is there a deadline driving the sale (1031 exchange, divorce, estate, relocation)? That informs how much negotiation room exists.
- Schools are D-rated, which usually means shorter tenancies and higher turnover. Who's the typical renter profile here, and what's been the actual vacancy rate?
- The area grade is low — what's the realistic commute time and amenity access for the typical tenant pool here? Any planned neighborhood developments (good or bad) we should know about?
- What's the average days-on-market for RENTAL listings here right now (not sales)? A rising rental-DOM trend means longer vacancies and softer asking-rent achievability than the comps imply.
- What's the recent tenant-quality profile in this submarket — average credit score on applications, eviction rate, late-payment / NSF rate, and stable-employment percentage? A property-management company in the area should have these aggregated.
CashFlowRE · CFR-XMW6DSEST9VCTA
· Data 1 day ago
cashflowre.app · 2026-05-29