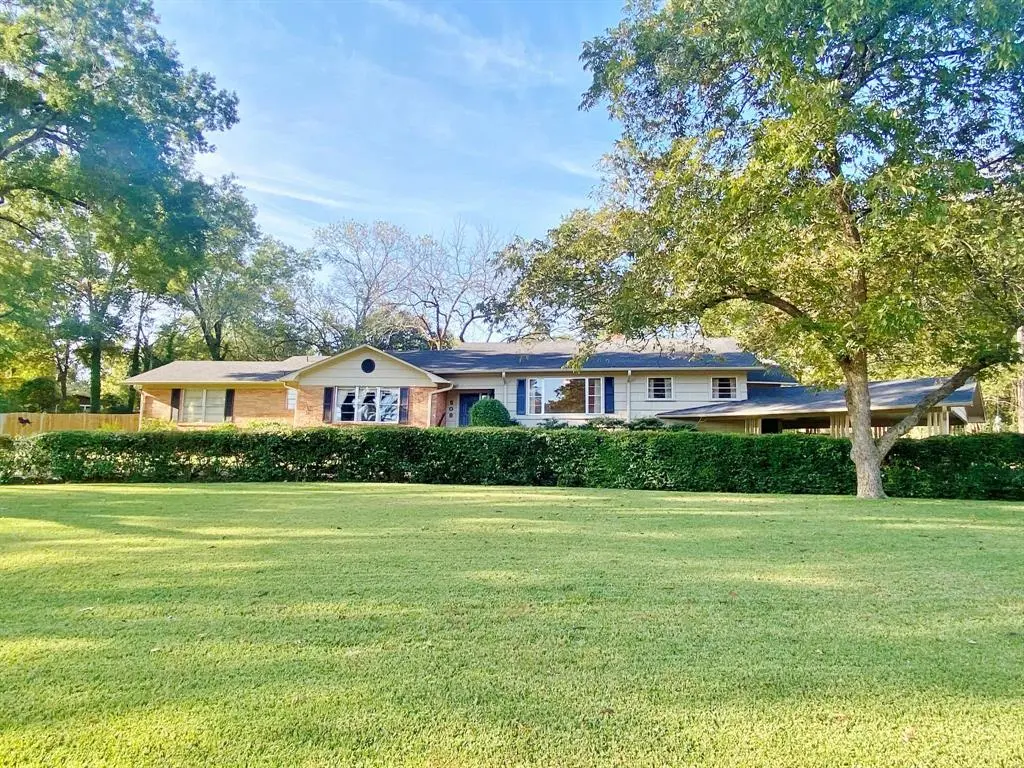
508 Dellwood · Mount Pleasant, TX
Flood risk 1/10 · Minimal
- FEMA flood zone
- X (unshaded)
- Chance of flooding over 30 yrs
- 0.0%
- Est. flood insurance / yr
- $507 – $1,088
Fire risk 5/10 · Moderate
- Est. fire insurance / yr
- $1,222 – $2,270
Heat risk 7/10 · Major
- Hot days now (above 112°F)
- 7 days/yr
- Hot days in 30 yrs
- 23 days/yr
Wind risk 6/10 · Moderate
- Chance of severe wind over 30 yrs
- 27.0%
Air-quality risk 2/10 · Minimal
- Unhealthy air days now
- 0 days/yr
- Unhealthy air days in 30 yrs
- 1 days/yr
Risk factors via First Street. Map © Google.
Why this score? — see what drove the D grade
The composite is a weighted blend of 9 inputs, each scored 0–100. Each bar is that input's sub-score; the figure is the points it added to the 100-point composite (weight × sub-score).
- ARV discount +14.8/15.0
- Cash flow +9.2/30.0
- Livability +3.9/5.0
- Schools +3.7/10.0
- 1% rule +3.3/10.0
- DSCR +2.6/10.0
- Rent growth +2.5/5.0
- Condition / age +2.5/5.0
- Appreciation +0.0/10.0
$249,000
🖨 Deal sheet 📄 Offer letter ✓ Due diligence
Listing remarks MLS
Built in 1955, this delightful home is nestled in the heart of Dellwood Park, offering a blend of classic architecture and enduring charm that truly stands the test of time. Its inviting exterior and thoughtful design make it a standout residence overlooking the park. Features 3 spacious bedrooms that provide comfortable retreats for family and guests, plus 2 well-appointed baths. Enjoy elegant entertaining in both the formal living and dining rooms, each featuring rich details and abundant natural light. Plus a sunken den just off the kitchen, the sunken den offers a cozy gathering place with wonderful views of the backyard, perfect for relaxing or hosting friends.
Key facts
- 0.77 acre lot
- Garage
- Built 1955
Property features AI
Finance
- Other: Lot roughly 0.77 acre (approximate size provided in listing data)
- Financial info: No second mortgage reported; Loan type recorded as Treat As Clear
- HOA & community: No homeowners association
Exterior
- Parking: 2 covered parking spaces; 2 carport spaces; Attached garage; Circular driveway
- Utilities: City water; City sewer; Electricity connected; Not in a municipal utility district
- Home design: Single-family residence; Residential property; One story; Preowned (built in 1955)
- Construction: Brick and wood construction; Composition roof; Year built 1955
- Exterior features: Park view lot
Interior
- Kitchen: Dishwasher; Electric cooktop; Electric oven
- Bedrooms: 3 bedrooms total; Primary bedroom on main level with separate shower
- Bathrooms: 2 full bathrooms
- Heating & cooling: Central heating; Central air conditioning; Wood-burning fireplace
- Interior features: Cable TV available; Basement present; One-level layout; Two living areas; One dining area; Three total rooms (listed room count)
- Laundry & utility: Washer/dryer hookup (laundry & utility appliances not specifically listed)
Neighborhood map
What this means for you Summary
Snapshot
- This is a 3-bed/2.0-bath single-family listed at $249k.
Deal economics
- At list price, monthly cash flow is $-189 ($-2k/yr) — negative.
- To cash-flow at today's rent, offer at most $216k (13.4% below list).
- To meet the 1% rule (rent ≥ 1% of price), the offer needs to be $207k (16.8% below list).
- Recommended offer: $207k (16.8% below list) — sets the bar for 1% rule.
- Cap rate 5.4% vs local median 3.5% in Mount Pleasant — top-decile yield for the area; either an underpriced asset or a hidden risk that comps aren't pricing in. Stress-test before assuming the spread holds.
Location & tenants
- Location reads 77/100 on livability (#81 in TX, #2,808 nationally) — a middle-class / working-renter tenant base. Strengths: cost of living A+, housing A+, health & safety A+; Watch: employment C-, amenities D-, commute F.
- Mount Pleasant ISD (town): math 45% / reading 44% proficiency, ranked #291 of 826 in TX (top 35%) — families likely to look elsewhere, expect single-tenant / working-renter base with shorter leases; 74% free/reduced lunch — lower-income household profile, screen leases tightly.
- Zoned schools: E C Brice El (math 47% / reading 52%, grade D, #865 of 4,322 statewide, top 21%, 460 students, 80% FRL).
- Market conditions: 382 active listings in the ZIP; 2 comparable units currently listed for rent nearby; 47 units permitted in Titus County in 2024 (10 in 5+ unit buildings).
- This rent runs 44% of the median local income ($56k/yr) — at the standard rent-burdened threshold; future hikes will face affordability resistance.
Forward outlook
- Local home prices are declining (-3.0%/yr); year-one equity from $2k of loan paydown is wiped out by about $7k of value loss. Plan a longer hold.
Negotiation context
- It's been on market 53 days — a 3% lower offer ($242k) is reasonable based on typical stale-listing flexibility.
- 7 sale attempts since 2y ago with the ask held roughly flat each time — persistent listings suggest the price (not the market) is what's stuck; bring a comps-based counter.
Risks & watch-outs
- Watch-outs: built in 1955 — expect roof / HVAC / electrical / plumbing capex.
- Climate carrying-cost: major wind risk, 27% chance of damaging wind over 30y; moderate wildfire risk; extreme-heat days projected 7→23/yr by 2055 (HVAC capex compounding) — expect insurance premiums to compound above CPI over the hold.
Questions for the listing agent
- What do current leases actually rent for vs. the listed asking? Can we see a recent rent roll and the last 12 months of T-12 income?
- It's been on market 53 days. Have you received any prior offers? Is the seller open to a 17% concession, seller financing, or rate buy-down credit?
- Built in 1955 — when were the roof, HVAC, electrical panel, plumbing, and water heater last replaced?
- Is there a deadline driving the sale (1031 exchange, divorce, estate, relocation)? That informs how much negotiation room exists.
- Schools are D-rated, which usually means shorter tenancies and higher turnover. Who's the typical renter profile here, and what's been the actual vacancy rate?
- The area grade is low — what's the realistic commute time and amenity access for the typical tenant pool here? Any planned neighborhood developments (good or bad) we should know about?
- What's the average days-on-market for RENTAL listings here right now (not sales)? A rising rental-DOM trend means longer vacancies and softer asking-rent achievability than the comps imply.
- What's the recent tenant-quality profile in this submarket — average credit score on applications, eviction rate, late-payment / NSF rate, and stable-employment percentage? A property-management company in the area should have these aggregated.
- How much new for-sale + rental construction is in the pipeline within 1–3 miles? Heavy new supply typically softens prices + rents 12–24 months out; constrained supply supports both.
Investment metrics
- 1% rule
- 0.83% ✗
- Cap rate
- 5.38%
- Cash-on-cash
- -3.25%
- DSCR
- 0.86
- GRM
- 10.0
CMA / ARV
- ARV (median comp)
- $296,984
- List price
- $249,000
- Delta
- -16.16%
- Verdict
- UNDERPRICED
- Comps
- 20 within 1.0 mi
Show comp detail 4 sales within ~0.75 mi
| Address | Dist | Beds/Ba | Sqft | Sold | Price | $/sf | Match |
|---|---|---|---|---|---|---|---|
| 804 Fleming Dr | 0.25mi | 4/3.0 (+1) | 2,554 (-10%) | 11mo | $319,000 | $125 | 52 |
| 909 Holly Hl | 0.35mi | 4/3.0 (+1) | 2,615 (-8%) | 10mo | $460,000 | $176 | 52 |
| 1108 S Williams Ave | 0.24mi | 3/3.0 | 2,511 (-12%) | 20mo | $344,000 | $137 | 48 |
| 822 Alexander Rd | 0.62mi | 4/3.0 (+1) | 3,242 (+14%) | 15mo | $485,000 | $150 | 26 |
Match score weights: distance 35% · size 25% · config 20% · recency 20%. Top-matched comps best support the ARV.
Projected returns pro-forma
-3.0% appreciation · 3.0% rent growth · sell at horizon
- IRR
- -21.7%
- Equity multiple
- 0.25×
- Total profit
- $-52,275
- Equity at exit
- $37,127
- IRR
- -15.3%
- Equity multiple
- 0.13×
- Total profit
- $-60,612
- Equity at exit
- $21,529
Cash invested: $69,720 (down + closing). Projections, not guarantees.
Landlord ↔ Tenant lean methodology
- Overall (STATE)
- 87 Strongly Landlord-Friendly
- State Texas
- 87 Strongly Landlord-Friendly · R+5
- County
- — inherits STATE
- City
- — inherits STATE
ZIP-level market 75455
- Home prices YoY
- -27.0%
- Active inventory
- 382
- Price-to-rent
- 10.0×
Monthly cashflow live
- Estimated rent
- $2,072 medium interval (Pro) →
- Mortgage (P&I)
- −$1,306
- Tax from tax record
- −$416 /mo · $4,997/yr
- Insurance
- −$104
- HOA
- −$0
- Vacancy / Maint / Mgmt
- −$435
- Net cashflow
- $-189
Break-even live
UW: 25.0% down · 7.5% · 30yr · 1.5% tax · 5.0% vac · 8.0% maint · 8.0% mgmt
Financing live
Cash to close
- Down payment
- $62,250
- Closing costs
- $7,470
- Reserves months
- —
- Total cash needed
- —
Loan-product check · same deal, 3 products live
Conventional
25% down · 7.5% · 30yr
- Down + closing
- —
- Monthly P&I
- —
- Monthly cashflow
- —
- DSCR
- —
- Eligible?
- —
Personal DTI + credit; lowest rate.
DSCR
20% down · 8.5% · 30yr
- Down + closing
- —
- Monthly P&I
- —
- Monthly cashflow
- —
- DSCR
- —
- Eligible?
- —
No personal income docs; deal must DSCR.
Hard money
10% down · 12.0% · 12mo
- Down + closing
- —
- Monthly P&I
- —
- Monthly cashflow
- —
- DSCR
- —
- Eligible?
- —
Short-term bridge; refi at stabilization.
Rent comps 2 comps
| Address | Beds | Baths | Sqft | Rent | $/sqft | DOM | Units | Dist |
|---|---|---|---|---|---|---|---|---|
| 2304 Deanna Ave Mount Pleasant, TX | 4.0 | 3.0 | 2830 | $2,450 | $0.87 | 43d | 1 | 0.94mi |
| 410 E 4th St Mt Pleasant, TX | 3.0 | 2.5 | 2953 | $2,250 | $0.76 | 20d | 1 | 0.97mi |
Listing history 26 events
-
2026-06-19days on market $249,000 Active 53 DOM
-
2026-06-18days on market $249,000 Active 52 DOM
-
2026-06-17days on market $249,000 Active 51 DOM
-
2026-06-16days on market $249,000 Active 50 DOM
-
2026-06-15days on market $249,000 Active 49 DOM
-
2026-06-14days on market $249,000 Active 47 DOM
-
2026-06-12days on market $249,000 Active 46 DOM
-
2026-06-09days on market $249,000 Active 43 DOM
-
2026-06-08days on market $249,000 Active 42 DOM
-
2026-06-07days on market $249,000 Active 41 DOM
-
2026-06-07days on market $249,000 Active 40 DOM
-
2026-06-03days on market $249,000 Active 37 DOM
-
2026-06-02days on market $249,000 Active 36 DOM
-
2026-06-01days on market $249,000 Active 35 DOM
-
2026-05-31days on market $249,000 Active 34 DOM
-
2026-05-30days on market $249,000 Active 33 DOM
-
2026-04-27$249,000 Active 674-char remark
Show marketing remark (674 chars)
Built in 1955, this delightful home is nestled in the heart of Dellwood Park, offering a blend of classic architecture and enduring charm that truly stands the test of time. Its inviting exterior and thoughtful design make it a standout residence overlooking the park. Features 3 spacious bedrooms that provide comfortable retreats for family and guests, plus 2 well-appointed baths. Enjoy elegant entertaining in both the formal living and dining rooms, each featuring rich details and abundant natural light. Plus a sunken den just off the kitchen, the sunken den offers a cozy gathering place with wonderful views of the backyard, perfect for relaxing or hosting friends.
-
2026-04-27$249,000 Active 680-char remark
Show marketing remark (674 chars)
Built in 1955, this delightful home is nestled in the heart of Dellwood Park, offering a blend of classic architecture and enduring charm that truly stands the test of time. Its inviting exterior and thoughtful design make it a standout residence overlooking the park. Features 3 spacious bedrooms that provide comfortable retreats for family and guests, plus 2 well-appointed baths. Enjoy elegant entertaining in both the formal living and dining rooms, each featuring rich details and abundant natural light. Plus a sunken den just off the kitchen, the sunken den offers a cozy gathering place with wonderful views of the backyard, perfect for relaxing or hosting friends.
-
2026-04-23historical
-
2025-10-25$249,000 Active
-
2025-10-24$249,000 Active
-
2024-09-18$245,000 Active
-
2024-09-13price $245,000
-
2024-03-30status Active
-
2024-03-23historical
-
2024-03-08$250,000 Active
ⓘ Source: listings_history table (triggers on properties + properties_extension) + one-shot
backfill from property_details.listing_events for pre-trigger history.
Tax reassessment forecast TX · Resets to sale price
- Current annual tax
- $4,997 · $416/mo
- Projected year-2 tax
- $4,997 · $416/mo
- Expected delta
- $0/yr ($0/mo · 0.0%)
ⓘ Screening estimate from a state-policy table — verify with the county assessor before closing.
Climate risk First Street
- Flood 1/10 Low FEMA zone X (unshaded) · 0% chance over 30 yrs
- Wildfire 5/10 Major
- Heat 7/10 Severe 7 d/yr ≥112°F today · 23 d/yr by 30 yrs out
- Wind 6/10 Major 27% chance of damaging wind over 30 yrs
- Air quality 2/10 Low 0 unhealthy d/yr today · 1 by 30 yrs out
Nearby sold comps map
Loading sold comps map…
Walkable amenities ~0.75 mi
Loading nearby amenities…
Taxation est. · year 1
- Rental income
- $24,868
- − Mortgage interest
- −$13,948
- − Property taxes
- −$4,997
- − Insurance
- −$1,245
- − Repairs & maintenance
- −$1,989
- − Management
- −$1,989
- − Depreciation
- −$7,244
- Taxable loss
- −$6,544
- Est. tax savings @ 24.0%
- +$1,571
- After-tax cash flow
- $-695/yr
For passive investors: Depreciation is non-cash, so a rental often shows a tax loss while cash-flowing — sheltering income. Rental losses are passive: they offset passive income freely, and up to $25,000/yr can offset ordinary (W-2) income if you actively participate and your MAGI is under $100k (phasing out to $0 by $150k); unused losses carry forward. On sale, claimed depreciation is recaptured at up to 25%, and gains may owe capital-gains tax (a 1031 exchange can defer both). Figures are a year-1 estimate at your 24.0% rate — not tax advice; consult a CPA.
Schools (NCES district)
- District
- Mount Pleasant ISD
- NCES district ID
- 4831760
- Math proficiency
- 45% ▼ -7.00%
- Reading proficiency
- 44% ▲ 2.00%
- Median HH income
- $40,642
- Composite
- 37.35/100
- National rank
- #4437
- State rank
- #291 of 826 in TX
Livability — Mount Pleasant
- Score
- 77/100
- State rank
- #81
- US rank
- #2808
Category grades
Schools grade is shown separately in the Schools card above.
Census & demographics
- Census place
- Mount Pleasant, TX
- County
- Titus County · 26,903 people
- City population
- 26,903
- Metro
- Mount Pleasant, TX
- Population (ZIP)
- 26,903
- Household income
- $56,163
- Rent vs Own
- Severe rent burden
- 758.0
Population outlook (Titus County) Hauer SSP2
- Today (2025)
- 33,205 people
- By 2030
- 33,187 · -0.1%
- By 2040
- 32,931 · -0.8%
- By 2050
- 32,231 · -2.9%
- By 2075
- 29,507 · -11.1%
- By 2100
- 25,369 · -23.6%
Race, ethnicity, and origin ACS 2023
- Neighborhood character
- Diverse neighborhood (Simpson 0.61)
- Race & ethnicity
- Hispanic / Latino 45% White 42% Two or more races 15% Black 10% Asian 1%
- Hispanic origin (detail)
- Mexican 42%
- Common ancestry
- Lithuanian 1% Slovak 1% Italian 1%
- Foreign-born
- 18% · Canada, Vietnam
- Languages at home
- 61% English-only · Spanish 37% Vietnamese 1%
Political lean MEDSL · Titus
- 2024 margin
- Solid R (+54.7) · D 22.3% · R 77.0%
- 2008→2024 swing
- -23.5pp toward R · 2008: -31.2pp · 2024: -54.7pp
- All cycles
- 2024: R+54.7 2020: R+44.7 2016: R+42.1 2012: R+39.0 2008: R+31.2
Not yet ingested
- Civics
- —
Market trends
- HPI YoY
- ▼ -79.66%
- Current HPI
- 215.4205
- Rent YoY
- —
- Metro
- Mount Pleasant, TX
- State GDP YoY
- ▲ 3.95%
- F500 in state
- 110
Industry mix (Fortune 500 HQ in TX)
| Industry | F500 HQs | Revenue |
|---|---|---|
| Energy | 16 | $1,198B |
|
||
| Technology | 5 | $198B |
|
||
| Engineering / Construction | 4 | $72B |
|
||
| Energy Services | 3 | $60B |
|
||
| Utilities | 3 | $41B |
|
||
| Healthcare | 2 | $330B |
|
||
Price history
-0.4% since first listed10 events — show timeline
- 2026-04-27 Listed $249,000 GTAR
- 2026-04-27 Listed $249,000 NTREIS
- 2026-04-23 Listing Removed — NTREIS
- 2025-10-25 Listed $249,000 NTREIS
- 2025-10-24 Listed $249,000 GTAR
- 2024-09-18 Listed $245,000 GTAR
- 2024-09-13 Price Changed $245,000 GTAR
- 2024-03-30 Relisted — GTAR
- 2024-03-23 Delisted — GTAR
- 2024-03-08 Listed $250,000 GTAR
Property tax history
+4.0%/yrLatest (2025): $4,997 · -7.0% YoY. Source: county tax records.
Cash-flow waterfall
monthlySold comps — $/sqft
last 12 mo · ≤1 miLoading sold comps…