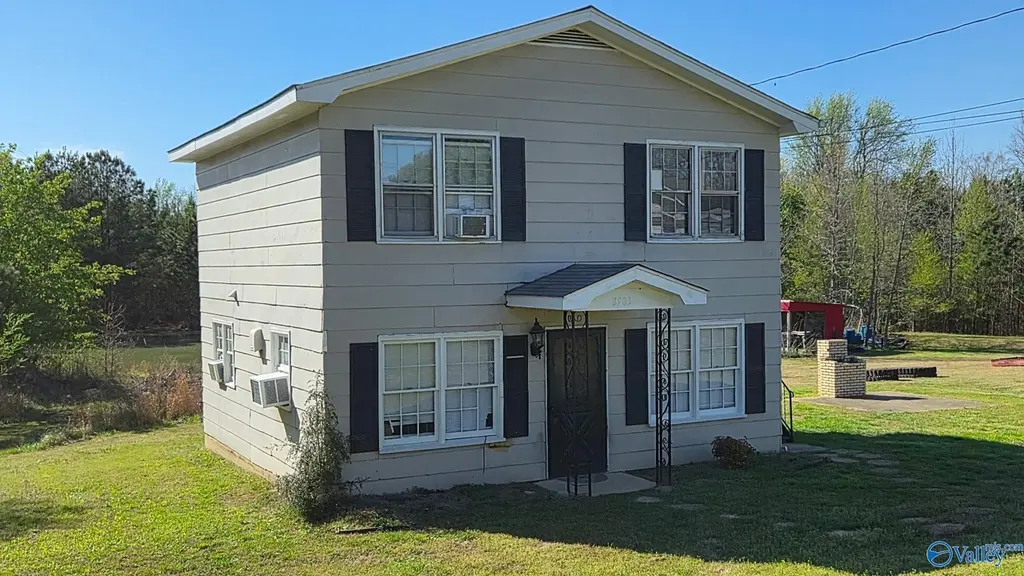
8921 Frankfort Rd
Tuscumbia, AL 35674
$1D
4 bd · 4.0 ba ·
1,200 sqft ·
Built —
· MultiFamily
· Active
· 21 DOM
Cashflow @ list (25.0% down · 7.5%)
Estimated rent
$1,626/mo
Mortgage (P&I)
−$0
Tax + insurance
−$0
HOA
−$0
Vac / Maint / Mgmt
−$341
Net cashflow
$1,285/mo
Annual
$15,414/yr
Cap rate
1541446.00%
Cash-on-cash
5505141.81%
DSCR
244948.83
1% rule
162600.00%
Cash to close
$0
Investor read
- This is a 2 × 2-bed/1.0-bath units multifamily listed at $1. Condition is rated fair.
- At list price, monthly cash flow is $1k ($15k/yr) — positive. Per door: $642/mo.
- The deal already cash-flows at list — no discount required.
- Meets the 1% rule at list price ($2k rent vs $1).
- It's been on market 21 days — a 2% lower offer ($0) is reasonable based on typical stale-listing flexibility.
- Local home prices are declining (-3.0%/yr); year-one equity from $0 of loan paydown is wiped out by about $0 of value loss. Plan a longer hold.
- Location reads 65/100 on livability (#122 in AL) — a middle-class / working-renter tenant base. Strengths: crime A+, cost of living A+, housing A+; Watch: employment D, schools D-, amenities F.
- Colbert County (rural): math 13% / reading 38% proficiency, ranked #90 of 129 in AL (top 70%) — low school quality limits family demand, transient renter base, plan for 1-2y turnover.
- Market conditions: 220 active listings in the ZIP; 91 units permitted in Colbert County in 2024 (0 in 5+ unit buildings).
- Colbert County population projected to shrink 7% by 2050 — rents likely to lag national; underwrite the cash flow, not the appreciation.
- 5 sale attempts since 3y ago with the ask held roughly flat each time — persistent listings suggest the price (not the market) is what's stuck; bring a comps-based counter.
- At projected returns (-3.0% appreciation + 3.0% rent growth), your $0 cash investment doubles in ~1 year — after that, you're playing with house money.
- Climate carrying-cost: major wildfire risk; extreme-heat days projected 7→19/yr by 2055 (HVAC capex compounding) — expect insurance premiums to compound above CPI over the hold.
- Cap rate 1541446.0% vs local median 4.4% in Tuscumbia — top-decile yield for the area; either an underpriced asset or a hidden risk that comps aren't pricing in. Stress-test before assuming the spread holds.
- This rent runs 30% of the median local income ($65k/yr) — at the standard rent-burdened threshold; future hikes will face affordability resistance.
Questions for listing agent
- Can we see the unit-by-unit rent roll, current vacancy, and any below-market leases? What's the average tenancy length?
- What capital expenditures (roof, boiler, parking lot, exteriors) have been made in the last 5 years, and what's planned in the next 2?
- Have any recent inspections been done? Can we get a copy of the seller's disclosures and any deferred-maintenance estimates?
- Is there a deadline driving the sale (1031 exchange, divorce, estate, relocation)? That informs how much negotiation room exists.
- Schools are D-rated, which usually means shorter tenancies and higher turnover. Who's the typical renter profile here, and what's been the actual vacancy rate?
- The area grade is low — what's the realistic commute time and amenity access for the typical tenant pool here? Any planned neighborhood developments (good or bad) we should know about?
- What's the average days-on-market for RENTAL listings here right now (not sales)? A rising rental-DOM trend means longer vacancies and softer asking-rent achievability than the comps imply.
- What's the recent tenant-quality profile in this submarket — average credit score on applications, eviction rate, late-payment / NSF rate, and stable-employment percentage? A property-management company in the area should have these aggregated.
Repairs flagged (vision-AI assessment)
- Moderate: Exterior siding — Weathered appearance
- Moderate: Hardwood floors — Worn appearance
- Moderate: Interior walls — Signs of wear
- Moderate: Windows — Signs of wear
CashFlowRE · CFR-XPQWCPC7BT43FV
· Data 2 weeks ago
cashflowre.app · 2026-05-29