 🔨 Auction
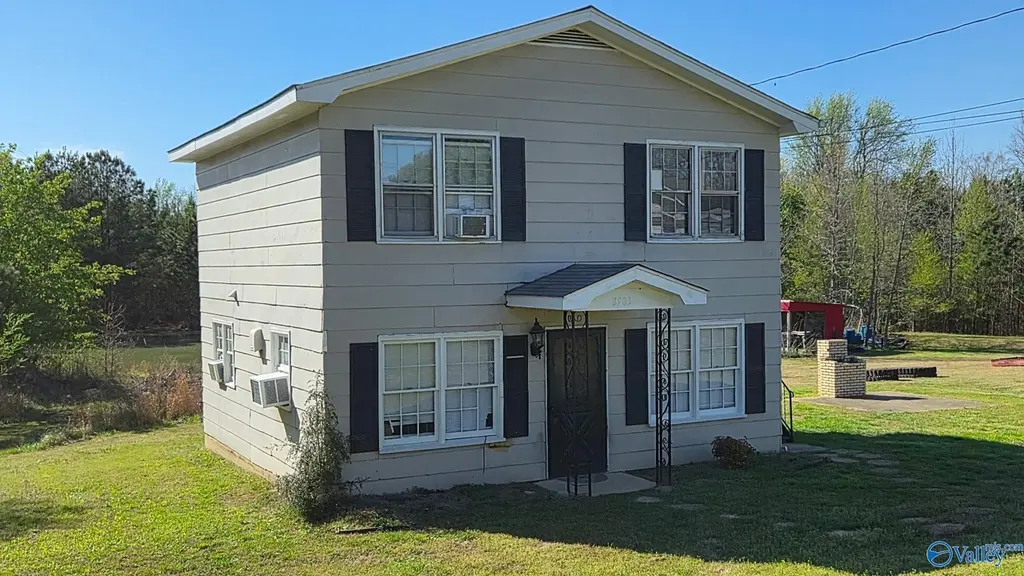
8921 Frankfort Rd · Tuscumbia, AL
Flood risk 1/10 · Minimal
- FEMA flood zone
- X (unshaded)
- Chance of flooding over 30 yrs
- 0.0%
- Est. flood insurance / yr
- $507 – $1,088
Fire risk 6/10 · Moderate
- Est. fire insurance / yr
- $916 – $1,700
Heat risk 5/10 · Moderate
- Hot days now (above 106°F)
- 7 days/yr
- Hot days in 30 yrs
- 19 days/yr
Wind risk 4/10 · Minor
- Chance of severe wind over 30 yrs
- 22.0%
Air-quality risk 1/10 · Minimal
- Unhealthy air days now
- 0 days/yr
- Unhealthy air days in 30 yrs
- 0 days/yr
Risk factors via First Street. Map © Google.
Why this score? — see what drove the D grade
The composite is a weighted blend of 9 inputs, each scored 0–100. Each bar is that input's sub-score; the figure is the points it added to the 100-point composite (weight × sub-score).
- Cash flow +15.0/30.0
- ARV discount +7.5/15.0
- 1% rule +5.0/10.0
- DSCR +5.0/10.0
- Livability +3.2/5.0
- Rent growth +2.5/5.0
- Condition / age +2.2/5.0
- Schools +2.1/10.0
- Appreciation +0.0/10.0
$1
🖨 Deal sheet 📄 Offer letter ✓ Due diligence
Multi-family units
County records classify this as Multi-Family (2-4 Unit). Listing-text estimate: 2 units. confirmed
Listing remarks
ONLINE ONLY PUBLIC AUCTION ENDS THURSDAY MAY 29 NOON. Located south of downtown Tuscumbia. This 2 story duplex has 2 one bedroom units with living room, kitchen, one full bath and sits on . 25 acres. Income producing with gross monthly rent of $1075. Don't miss this opportunity to purchase this property were "YOU SET THE PRICE" Property is occupied. Please do not disturb tenants and do not go on property. Make arrangements to attend open house to preview. OPEN HOUSE SUNDAY MAY 24 2-4PM.
Key facts
- 0.25 acre lot
- 4 parking spots
- Listed 21 days
Property features AI
Finance
- Other: Lot approximately 0.25 acre (about 90 x 120 dimensions)
- HOA & community: Subdivision: Metes And Bounds
Exterior
- Parking: Four parking spaces; Open parking available; Gravel driveway; Parking pad; Shared driveway
- Utilities: No gas service; Public water; Septic sewer; Electric power
- Home design: Residential income duplex; Two-story
- Construction: Frame construction
- Exterior features: No significant view; Public water source; Septic tank
Interior
- Kitchen: Oven; Refrigerator
- Heating & cooling: Electric heat; Window unit cooling
- Interior features: Window air conditioning units; Electric heating; Electric water heater
- Laundry & utility: Washer/dryer hookup
Neighborhood map
What this means for you Summary
Snapshot
- This is a 2 × 2-bed/1.0-bath units multifamily listed at $1. Condition is rated fair.
Deal economics
- At list price, monthly cash flow is $1k ($15k/yr) — positive. Per door: $642/mo.
- The deal already cash-flows at list — no discount required.
- Meets the 1% rule at list price ($2k rent vs $1).
- Cap rate 1541446.0% vs local median 4.4% in Tuscumbia — top-decile yield for the area; either an underpriced asset or a hidden risk that comps aren't pricing in. Stress-test before assuming the spread holds.
Location & tenants
- Location reads 65/100 on livability (#122 in AL) — a middle-class / working-renter tenant base. Strengths: crime A+, cost of living A+, housing A+; Watch: employment D, schools D-, amenities F.
- Colbert County (rural): math 13% / reading 38% proficiency, ranked #90 of 129 in AL (top 70%) — low school quality limits family demand, transient renter base, plan for 1-2y turnover.
- Market conditions: 220 active listings in the ZIP; 91 units permitted in Colbert County in 2024 (0 in 5+ unit buildings).
- This rent runs 30% of the median local income ($65k/yr) — at the standard rent-burdened threshold; future hikes will face affordability resistance.
Forward outlook
- Local home prices are declining (-3.0%/yr); year-one equity from $0 of loan paydown is wiped out by about $0 of value loss. Plan a longer hold.
- Colbert County population projected to shrink 7% by 2050 — rents likely to lag national; underwrite the cash flow, not the appreciation.
- At projected returns (-3.0% appreciation + 3.0% rent growth), your $0 cash investment doubles in ~1 year — after that, you're playing with house money.
Negotiation context
- It's been on market 21 days — a 2% lower offer ($0) is reasonable based on typical stale-listing flexibility.
- 5 sale attempts since 3y ago with the ask held roughly flat each time — persistent listings suggest the price (not the market) is what's stuck; bring a comps-based counter.
Risks & watch-outs
- Climate carrying-cost: major wildfire risk; extreme-heat days projected 7→19/yr by 2055 (HVAC capex compounding) — expect insurance premiums to compound above CPI over the hold.
Questions for the listing agent
- Can we see the unit-by-unit rent roll, current vacancy, and any below-market leases? What's the average tenancy length?
- What capital expenditures (roof, boiler, parking lot, exteriors) have been made in the last 5 years, and what's planned in the next 2?
- Have any recent inspections been done? Can we get a copy of the seller's disclosures and any deferred-maintenance estimates?
- Is there a deadline driving the sale (1031 exchange, divorce, estate, relocation)? That informs how much negotiation room exists.
- Schools are D-rated, which usually means shorter tenancies and higher turnover. Who's the typical renter profile here, and what's been the actual vacancy rate?
- The area grade is low — what's the realistic commute time and amenity access for the typical tenant pool here? Any planned neighborhood developments (good or bad) we should know about?
- What's the average days-on-market for RENTAL listings here right now (not sales)? A rising rental-DOM trend means longer vacancies and softer asking-rent achievability than the comps imply.
- What's the recent tenant-quality profile in this submarket — average credit score on applications, eviction rate, late-payment / NSF rate, and stable-employment percentage? A property-management company in the area should have these aggregated.
- How much new apartment / multifamily construction is in the pipeline within 1–3 miles? Heavy new supply (>2% of stock underway) typically softens rents 12–24 months out; light construction supports rent growth.
Investment metrics
- 1% rule
- 162600.00% ✓
- Cap rate
- 1541446.00%
- Cash-on-cash
- 5505141.81%
- DSCR
- 244948.83
- GRM
- 0.0
CMA / ARV
No comps found within radius.
Projected returns pro-forma
-3.0% appreciation · 3.0% rent growth · sell at horizon
- IRR
- —
- Equity multiple
- 292275.88×
- Total profit
- $81,837
- Equity at exit
- $0
- IRR
- —
- Equity multiple
- 631103.31×
- Total profit
- $176,709
- Equity at exit
- $0
Cash invested: $0 (down + closing). Projections, not guarantees.
Landlord ↔ Tenant lean methodology
- Overall (STATE)
- 90 Strongly Landlord-Friendly
- State Alabama
- 90 Strongly Landlord-Friendly · R+15
- County
- — inherits STATE
- City
- — inherits STATE
ZIP-level market 35674
- Home prices YoY
- -28.4%
- Active inventory
- 220
Monthly cashflow live
- Estimated rent
- $1,626 medium interval (Pro) →
- Mortgage (P&I)
- −$0
- Tax est. 1.5%
- −$0 /mo · $0/yr
- Insurance
- −$0
- HOA
- −$0
- Vacancy / Maint / Mgmt
- −$341
- Net cashflow
- $1,285
Break-even live
2-unit breakdown (identical units grouped — click to expand)
| Units | Beds | Baths | Est. rent |
|---|---|---|---|
| 2× units | 2 | 1 | $1,626 |
| #1 | 2 | 1 | $813 |
| #2 | 2 | 1 | $813 |
| Total (2 units) | $1,626 | ||
UW: 25.0% down · 7.5% · 30yr · 1.5% tax · 5.0% vac · 8.0% maint · 8.0% mgmt
Financing live
Cash to close
- Down payment
- $0
- Closing costs
- $0
- Reserves months
- —
- Total cash needed
- —
Loan-product check · same deal, 3 products live
Conventional
25% down · 7.5% · 30yr
- Down + closing
- —
- Monthly P&I
- —
- Monthly cashflow
- —
- DSCR
- —
- Eligible?
- —
Personal DTI + credit; lowest rate.
DSCR
20% down · 8.5% · 30yr
- Down + closing
- —
- Monthly P&I
- —
- Monthly cashflow
- —
- DSCR
- —
- Eligible?
- —
No personal income docs; deal must DSCR.
Hard money
10% down · 12.0% · 12mo
- Down + closing
- —
- Monthly P&I
- —
- Monthly cashflow
- —
- DSCR
- —
- Eligible?
- —
Short-term bridge; refi at stabilization.
Listing history 10 events
-
2026-05-31days on market $1 Active 21 DOM
-
2026-05-30days on market $1 Active 20 DOM
-
2026-05-10$1 Active 502-char remark
-
2023-10-02status Active
-
2023-09-11price $79,900
-
2023-07-06status Active
-
2023-06-23status Pending
-
2023-04-05status Active
-
2023-03-30status Pending
-
2023-03-15$90,000 Active
ⓘ Source: listings_history table (triggers on properties + properties_extension) + one-shot
backfill from property_details.listing_events for pre-trigger history.
Climate risk First Street
- Flood 1/10 Low FEMA zone X (unshaded) · 0% chance over 30 yrs
- Wildfire 6/10 Major
- Heat 5/10 Major 7 d/yr ≥106°F today · 19 d/yr by 30 yrs out
- Wind 4/10 Moderate 22% chance of damaging wind over 30 yrs
- Air quality 1/10 Low 0 unhealthy d/yr today · 0 by 30 yrs out
Nearby sold comps map
Loading sold comps map…
Walkable amenities ~0.75 mi
Loading nearby amenities…
Taxation est. · year 1
- Rental income
- $19,512
- − Mortgage interest
- −$0
- − Property taxes
- −$0
- − Insurance
- −$0
- − Repairs & maintenance
- −$1,561
- − Management
- −$1,561
- − Depreciation
- −$0
- Taxable income
- $16,390
- Est. tax owed @ 24.0%
- −$3,934
- After-tax cash flow
- $11,481/yr
For passive investors: Depreciation is non-cash, so a rental often shows a tax loss while cash-flowing — sheltering income. Rental losses are passive: they offset passive income freely, and up to $25,000/yr can offset ordinary (W-2) income if you actively participate and your MAGI is under $100k (phasing out to $0 by $150k); unused losses carry forward. On sale, claimed depreciation is recaptured at up to 25%, and gains may owe capital-gains tax (a 1031 exchange can defer both). Figures are a year-1 estimate at your 24.0% rate — not tax advice; consult a CPA.
Condition & rehab AI · 4 photos
This 2-story duplex requires moderate repairs and maintenance to improve its condition and value. Potential buyers should consider the cost of these improvements before making an offer.
Repairs flagged
- Moderate Exterior siding — Weathered appearance
- Moderate Hardwood floors — Worn appearance
- Moderate Interior walls — Signs of wear
- Moderate Windows — Signs of wear
Value-add opportunities
- Both Paint interior walls — Fresh paint can improve the home's appearance and value
- Rental Replace HVAC filters — Clean HVAC system improves tenant satisfaction and reduces maintenance costs
Renovation cost estimate screening
| Repair item | Severity | Est. cost |
|---|---|---|
| Exterior siding · Weathered appearance | Moderate | $3,000–15,000 |
| Hardwood floors · Worn appearance | Moderate | $3,000–15,000 |
| Interior walls · Signs of wear | Moderate | $3,000–15,000 |
| Windows · Signs of wear | Moderate | $3,000–15,000 |
| Total estimated repair cost · 4 items | $12,000–60,000 |
Value-add ROI direction
- Both Paint interior walls — Fresh paint can improve the home's appearance and value ↑
- Rental Replace HVAC filters — Clean HVAC system improves tenant satisfaction and reduces maintenance costs ↑
ⓘ Cost ranges are severity-bucket heuristics (US national rule-of-thumb). Get contractor quotes + a written scope before underwriting a rehab budget.
Schools (NCES district)
- District
- Colbert County
- NCES district ID
- 0100840
- Math proficiency
- 13% ▼ -24.00%
- Reading proficiency
- 38% ▬ 0.00%
- Median HH income
- $40,710
- Composite
- 21.48/100
- National rank
- #8328
- State rank
- #90 of 129 in AL
Livability — Tuscumbia
- Score
- 65/100
- State rank
- #122
- US rank
- #12659
Category grades
Schools grade is shown separately in the Schools card above.
Census & demographics
- County
- Colbert County · 20,176 people
- City population
- 20,176
- Metro
- Florence-Muscle Shoals, AL
- Population (ZIP)
- 20,176
- Household income
- $64,706
- Rent vs Own
- Severe rent burden
- 372.0
Population outlook (Colbert County) Hauer SSP2
- Today (2025)
- 54,154 people
- By 2030
- 53,746 · -0.8%
- By 2040
- 52,431 · -3.2%
- By 2050
- 50,303 · -7.1%
- By 2075
- 44,789 · -17.3%
- By 2100
- 36,676 · -32.3%
Race, ethnicity, and origin ACS 2023
- Neighborhood character
- Predominantly White (82%)
- Race & ethnicity
- White 82% Black 11% Hispanic / Latino 4% Two or more races 4%
- Common ancestry
- Slovak 2% Italian 1% Lithuanian 1%
- Foreign-born
- 2% · Canada
- Languages at home
- 98% English-only · Spanish 2%
Political lean MEDSL · Colbert
- 2024 margin
- Solid R (+46.4) · D 26.4% · R 72.8%
- 2008→2024 swing
- -26.2pp toward R · 2008: -20.3pp · 2024: -46.4pp
- All cycles
- 2024: R+46.4 2020: R+38.9 2016: R+38.3 2012: R+20.4 2008: R+20.3
Not yet ingested
- Civics
- —
Market trends
- HPI YoY
- ▼ -68.06%
- Current HPI
- 171.9693
- Rent YoY
- —
- Metro
- Florence-Muscle Shoals, AL
- State GDP YoY
- ▲ 2.94%
- F500 in state
- 4
Industry mix (Fortune 500 HQ in AL)
| Industry | F500 HQs | Revenue |
|---|---|---|
| Financial Services | 1 | $8B |
|
||
| Healthcare | 1 | $5B |
|
||
Price history
-11.2% since first listed8 events — show timeline
- 2026-05-10 Listed $1 VMLS
- 2023-10-02 Relisted — SAARMLS
- 2023-09-11 Price Changed $79,900 SAARMLS
- 2023-07-06 Relisted — SAARMLS
- 2023-06-23 Pending — SAARMLS
- 2023-04-05 Relisted — SAARMLS
- 2023-03-30 Pending — SAARMLS
- 2023-03-15 Listed $90,000 SAARMLS
Cash-flow waterfall
monthlySold comps — $/sqft
last 12 mo · ≤1 miLoading sold comps…