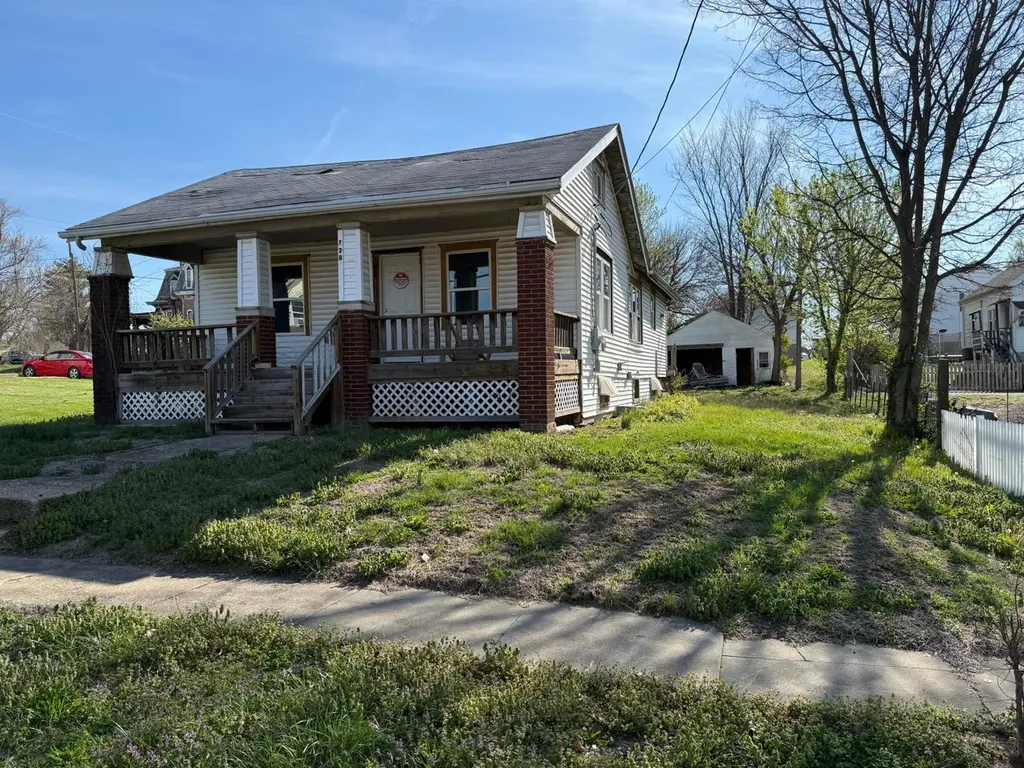
728 Grand Ave
Fulton, MO 65251
$39,000B-
2 bd · 1.0 ba ·
1,101 sqft ·
Built 1935
· SingleFamily
· Pending
· 12 DOM
Cashflow @ list (25.0% down · 7.5%)
Estimated rent
$998/mo
Mortgage (P&I)
−$205
Tax + insurance
−$64
HOA
−$0
Vac / Maint / Mgmt
−$210
Net cashflow
$520/mo
Annual
$6,241/yr
Cap rate
22.29%
Cash-on-cash
57.15%
DSCR
3.54
1% rule
2.56%
Cash to close
$10,920
Investor read
- This is a 2-bed/1.0-bath single-family listed at $39k.
- At list price, monthly cash flow is $520 ($6k/yr) — positive.
- The deal already cash-flows at list — no discount required.
- Meets the 1% rule at list price ($998 rent vs $39k).
- Only 12 days on market — expect competitive offers; lowballing is unlikely to land.
- Local home prices are declining (-3.0%/yr); year-one equity from $270 of loan paydown is wiped out by about $1k of value loss. Plan a longer hold.
- Location reads 71/100 on livability (#115 in MO) — a middle-class / working-renter tenant base. Strengths: cost of living A+, housing A+, crime B+; Watch: amenities F, commute F, employment D-.
- Fulton 58 (town): math 36% / reading 42% proficiency, ranked #158 of 324 in MO (top 49%) — families likely to look elsewhere, expect single-tenant / working-renter base with shorter leases.
- Zoned schools: Fulton Early Childhood Cntr (100 students, 59% FRL); Fulton Middle (math 36% / reading 37%, grade F, #231 of 391 statewide, top 60%, 498 students, 39% FRL); Fulton Sr. High (math 32% / reading 42%, grade F, #291 of 521 statewide, top 60%, 678 students, 33% FRL) — zoned schools at 44% FRL track the district average.
- Watch-outs: built in 1935 — expect roof / HVAC / electrical / plumbing capex.
- Market conditions: 140 active listings in the ZIP; 4 comparable units currently listed for rent nearby; rentals at typical pace (median 24d on market — plan ~3-4 weeks tenant-placement turnaround); 40 units permitted in Callaway County in 2024 (0 in 5+ unit buildings).
- 2 sale attempts with the ask held roughly flat each time — persistent listings suggest the price (not the market) is what's stuck; bring a comps-based counter.
- At projected returns (-3.0% appreciation + 3.0% rent growth), your $11k cash investment doubles in ~2 years — after that, you're playing with house money.
- Cap rate 22.3% vs local median 4.0% in Fulton — top-decile yield for the area; either an underpriced asset or a hidden risk that comps aren't pricing in. Stress-test before assuming the spread holds.
Questions for listing agent
- Built in 1935 — when were the roof, HVAC, electrical panel, plumbing, and water heater last replaced?
- Is there a deadline driving the sale (1031 exchange, divorce, estate, relocation)? That informs how much negotiation room exists.
- What's the average days-on-market for RENTAL listings here right now (not sales)? A rising rental-DOM trend means longer vacancies and softer asking-rent achievability than the comps imply.
- What's the recent tenant-quality profile in this submarket — average credit score on applications, eviction rate, late-payment / NSF rate, and stable-employment percentage? A property-management company in the area should have these aggregated.
- How much new for-sale + rental construction is in the pipeline within 1–3 miles? Heavy new supply typically softens prices + rents 12–24 months out; constrained supply supports both.
CashFlowRE · CFR-XQS2E90E5NS2XX
· Data 4 weeks ago
cashflowre.app · 2026-05-29