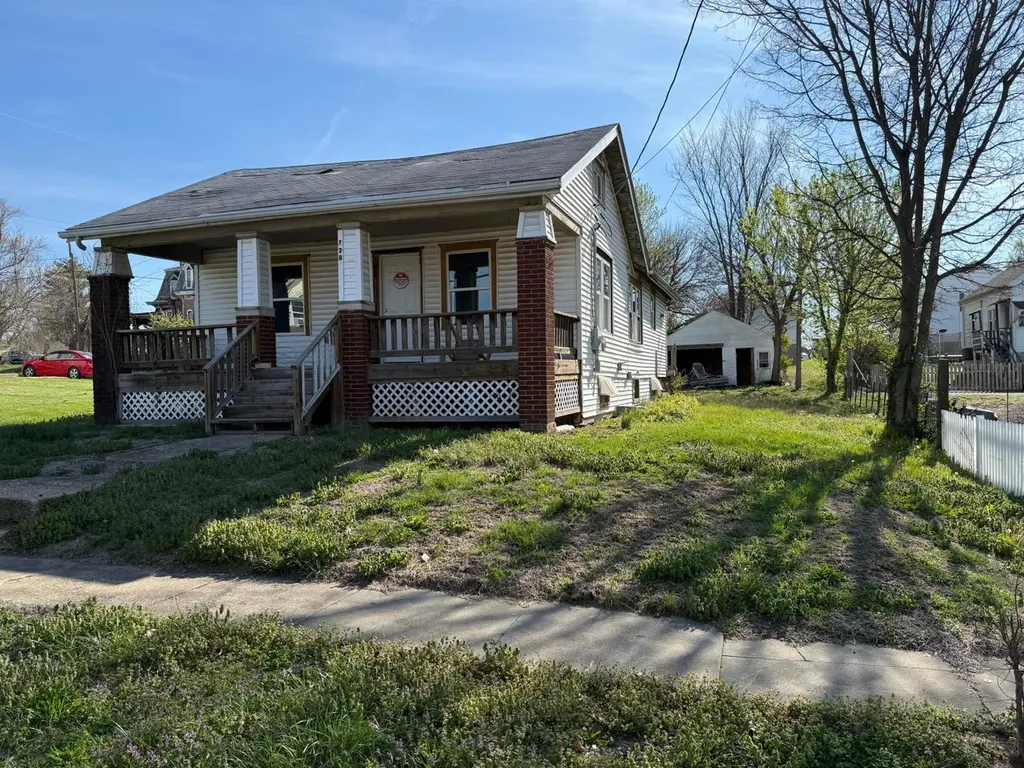
728 Grand Ave · Fulton, MO
Flood risk 1/10 · Minimal
- FEMA flood zone
- X (unshaded)
- Chance of flooding over 30 yrs
- 0.0%
- Est. flood insurance / yr
- $473 – $860
Fire risk 4/10 · Minor
- Est. fire insurance / yr
- $1,054 – $1,958
Heat risk 4/10 · Minor
- Hot days now (above 106°F)
- 7 days/yr
- Hot days in 30 yrs
- 19 days/yr
Wind risk 2/10 · Minimal
- Chance of severe wind over 30 yrs
- —
Air-quality risk 2/10 · Minimal
- Unhealthy air days now
- 1 days/yr
- Unhealthy air days in 30 yrs
- 1 days/yr
Risk factors via First Street. Map © Google.
Why this score? — see what drove the B- grade
The composite is a weighted blend of 9 inputs, each scored 0–100. Each bar is that input's sub-score; the figure is the points it added to the 100-point composite (weight × sub-score).
- Cash flow +30.0/30.0
- 1% rule +10.0/10.0
- DSCR +10.0/10.0
- ARV discount +7.5/15.0
- Livability +3.6/5.0
- Schools +3.3/10.0
- Rent growth +2.5/5.0
- Condition / age +2.5/5.0
- Appreciation +0.0/10.0
$39,000
🖨 Deal sheet (PDF) 📄 Offer letter ✓ Due diligence
Listing remarks MLS
Home interior has been demo-ed and is ready for finish work to begin. Stay with the original floor plan and you will have 2 bedrooms, 1 bathroom, living room, dining area, kitchen and area to the rear for utilities and storage. Home is on a basement with previous stabilization repairs. Additional lot to the rear has a 1 car garage, that is also in need of repair. New windows and exterior doors are in place, and exterior siding is in good condition. Home will need new shingles on the roof and repair to at least some of the roof structure. Property is strictly sold ''AS IS''
Key facts
- Exterior siding
- Exterior doors
- Additional lot
Tags
Property features AI
Exterior
- Parking: Detached 2-car garage
- Utilities: Public water
- Home design: Single-family residence; Residential property; Faces west
- Construction: Composition roof; R-1 one-family dwelling zoning
- Exterior features: Front porch; Cleared lot; Paved road access; Lot dimensions approximately 62 x 75 (0.24 acres)
Interior
- Bedrooms: 1 total room
- Bathrooms: 1 full bathroom
- Interior features: Basement
Neighborhood map
What this means for you Summary
Snapshot
- This is a 2-bed/1.0-bath single-family listed at $39k.
Deal economics
- At list price, monthly cash flow is $520 ($6k/yr) — positive.
- The deal already cash-flows at list — no discount required.
- Meets the 1% rule at list price ($998 rent vs $39k).
- Cap rate 22.3% vs local median 3.9% in Fulton — top-decile yield for the area; either an underpriced asset or a hidden risk that comps aren't pricing in. Stress-test before assuming the spread holds.
Location & tenants
- Location reads 71/100 on livability (#115 in MO) — a middle-class / working-renter tenant base. Strengths: cost of living A+, housing A+, crime B+; Watch: amenities F, commute F, employment D-.
- Fulton 58 (town): math 36% / reading 42% proficiency, ranked #158 of 324 in MO (top 49%) — families likely to look elsewhere, expect single-tenant / working-renter base with shorter leases.
- Zoned schools: Fulton Early Childhood Cntr (100 students, 59% FRL); Fulton Middle (math 36% / reading 37%, grade F, #231 of 391 statewide, top 60%, 498 students, 39% FRL); Fulton Sr. High (math 32% / reading 42%, grade F, #291 of 521 statewide, top 60%, 678 students, 33% FRL) — zoned schools at 44% FRL track the district average.
- Market conditions: 137 active listings in the ZIP; 4 comparable units currently listed for rent nearby; rentals at typical pace (median 23d on market — plan ~3-4 weeks tenant-placement turnaround); 40 units permitted in Callaway County in 2024 (0 in 5+ unit buildings).
Forward outlook
- Local home prices are declining (-3.0%/yr); year-one equity from $270 of loan paydown is wiped out by about $1k of value loss. Plan a longer hold.
- At projected returns (-3.0% appreciation + 3.0% rent growth), your $11k cash investment doubles in ~2 years — after that, you're playing with house money.
Negotiation context
- Only 12 days on market — expect competitive offers; lowballing is unlikely to land.
- 2 sale attempts with the ask held roughly flat each time — persistent listings suggest the price (not the market) is what's stuck; bring a comps-based counter.
Risks & watch-outs
- Watch-outs: built in 1935 — expect roof / HVAC / electrical / plumbing capex.
Questions for the listing agent
- Built in 1935 — when were the roof, HVAC, electrical panel, plumbing, and water heater last replaced?
- Is there a deadline driving the sale (1031 exchange, divorce, estate, relocation)? That informs how much negotiation room exists.
- What's the average days-on-market for RENTAL listings here right now (not sales)? A rising rental-DOM trend means longer vacancies and softer asking-rent achievability than the comps imply.
- What's the recent tenant-quality profile in this submarket — average credit score on applications, eviction rate, late-payment / NSF rate, and stable-employment percentage? A property-management company in the area should have these aggregated.
- How much new for-sale + rental construction is in the pipeline within 1–3 miles? Heavy new supply typically softens prices + rents 12–24 months out; constrained supply supports both.
Investment metrics
- 1% rule
- 2.56% ✓
- Cap rate
- 22.29%
- Cash-on-cash
- 57.15%
- DSCR
- 3.54
- GRM
- 3.3
CMA / ARV
- ARV (median comp)
- $144,116
- List price
- $39,000
- Delta
- -72.94%
- Verdict
- UNDERPRICED
- Comps
- 20 within 1.0 mi
Show comp detail 12 sales within ~0.75 mi
| Address | Dist | Beds/Ba | Sqft | Sold | Price | $/sf | Match |
|---|---|---|---|---|---|---|---|
| 728 Grand Ave | 0.00mi | 2/1.0 | 1,101 (0%) | 1mo | $39,000 | $35 | 100 |
| 805 State St | 0.15mi | 3/2.0 (+1) | 1,104 (+0%) | 7mo | $235,000 | $213 | 78 |
| 712 Jefferson St | 0.39mi | 2/1.0 | 1,121 (+2%) | 13mo | $90,000 | $80 | 68 |
| 408 NE 8th St | 0.11mi | 3/2.0 (+1) | 1,144 (+4%) | 16mo | $230,000 | $201 | 66 |
| 910 Grand St | 0.23mi | 2/1.0 | 978 (-11%) | 10mo | $99,900 | $102 | 62 |
| 107 Saults St | 0.42mi | 3/1.0 (+1) | 1,020 (-7%) | 10mo | $135,000 | $132 | 55 |
| 321 W 8th St | 0.56mi | 2/2.0 | 1,080 (-2%) | 15mo | $69,000 | $64 | 54 |
| 910 Nichols St | 0.39mi | 3/1.5 (+1) | 1,036 (-6%) | 16mo | $165,000 | $159 | 52 |
| 817 Kay Dr | 0.66mi | 2/1.0 | 970 (-12%) | 1mo | $159,500 | $164 | 48 |
| 903 Vine St | 0.24mi | 3/1.5 (+1) | 1,243 (+13%) | 17mo | $132,500 | $107 | 46 |
| 403 E First St | 0.58mi | 1/1.0 (-1) | 1,000 (-9%) | 14mo | $140,000 | $140 | 41 |
| 402 W 9th St | 0.67mi | 3/1.0 (+1) | 936 (-15%) | 10mo | $145,000 | $155 | 30 |
Match score weights: distance 35% · size 25% · config 20% · recency 20%. Top-matched comps best support the ARV.
Projected returns pro-forma
-3.0% appreciation · 3.0% rent growth · sell at horizon
- IRR
- 55.6%
- Equity multiple
- 3.46×
- Total profit
- $26,817
- Equity at exit
- $5,815
- IRR
- 60.6%
- Equity multiple
- 7.05×
- Total profit
- $66,060
- Equity at exit
- $3,372
Cash invested: $10,920 (down + closing). Projections, not guarantees.
Landlord ↔ Tenant lean methodology
- Overall (STATE)
- 81 Strongly Landlord-Friendly
- State Missouri
- 81 Strongly Landlord-Friendly · R+10
- County
- — inherits STATE
- City
- — inherits STATE
ZIP-level market 65251
- Active inventory
- 137
- Price-to-rent
- 3.3×
Monthly cashflow live
- Estimated rent
- $998 medium interval (Pro) →
- Mortgage (P&I)
- −$205
- Tax from tax record
- −$48 /mo · $572/yr
- Insurance
- −$16
- HOA
- −$0
- Lot rent
- −$0
- Vacancy / Maint / Mgmt
- −$210
- Net cashflow
- $520
Break-even live
Sensitivity live
| Price | -10% $542 | -5% $531 | +0% $520 | +5% $509 | +10% $498 |
|---|---|---|---|---|---|
| Rent | -10% $441 | -5% $481 | +0% $520 | +5% $559 | +10% $599 |
| Rate | -1.0pp $540 | -0.5pp $530 | base $520 | +0.5pp $510 | +1.0pp $500 |
UW: 25.0% down · 7.5% · 30yr · 1.5% tax · 5.0% vac · 8.0% maint · 8.0% mgmt
Financing live
Cash to close
- Down payment
- $9,750
- Closing costs
- $1,170
- Reserves months
- —
- Total cash needed
- —
Loan-product check · same deal, 3 products live
Conventional
25% down · 7.5% · 30yr
- Down + closing
- —
- Monthly P&I
- —
- Monthly cashflow
- —
- DSCR
- —
- Eligible?
- —
Personal DTI + credit; lowest rate.
DSCR
20% down · 8.5% · 30yr
- Down + closing
- —
- Monthly P&I
- —
- Monthly cashflow
- —
- DSCR
- —
- Eligible?
- —
No personal income docs; deal must DSCR.
Hard money
10% down · 12.0% · 12mo
- Down + closing
- —
- Monthly P&I
- —
- Monthly cashflow
- —
- DSCR
- —
- Eligible?
- —
Short-term bridge; refi at stabilization.
Rent comps 4 comps
| Address | Beds | Baths | Sqft | Rent | $/sqft | DOM | Units | Dist |
|---|---|---|---|---|---|---|---|---|
| 803 Court St Unit D Fulton, MO | 1.0 | 1.0 | 820 | $755 | $0.92 | 46d | 1 | 0.27mi |
| 103 E 10th St Fulton, MO | 2.0 | 1.5 | 850 | $815 | $0.96 | 15d | 1 | 0.30mi |
| 301 W 14th St Fulton, MO | 3.0 | 1.0 | 1240 | $1,500 | $1.21 | 15d | 1 | 0.74mi |
| 501 Stack Rd Fulton, MO | 3.0 | 1.5 | 1200 | $1,275 | $1.06 | 23d | 1 | 1.35mi |
Listing history 2 events
-
2026-05-06status Pending 579-char remark
Show marketing remark (579 chars)
Home interior has been demo-ed and is ready for finish work to begin. Stay with the original floor plan and you will have 2 bedrooms, 1 bathroom, living room, dining area, kitchen and area to the rear for utilities and storage. Home is on a basement with previous stabilization repairs. Additional lot to the rear has a 1 car garage, that is also in need of repair. New windows and exterior doors are in place, and exterior siding is in good condition. Home will need new shingles on the roof and repair to at least some of the roof structure. Property is strictly sold ''AS IS''
-
2026-04-24$39,000 Active 579-char remark
Show marketing remark (579 chars)
Home interior has been demo-ed and is ready for finish work to begin. Stay with the original floor plan and you will have 2 bedrooms, 1 bathroom, living room, dining area, kitchen and area to the rear for utilities and storage. Home is on a basement with previous stabilization repairs. Additional lot to the rear has a 1 car garage, that is also in need of repair. New windows and exterior doors are in place, and exterior siding is in good condition. Home will need new shingles on the roof and repair to at least some of the roof structure. Property is strictly sold ''AS IS''
ⓘ Source: listings_history table (triggers on properties + properties_extension) + one-shot
backfill from property_details.listing_events for pre-trigger history.
Tax reassessment forecast MO · Resets to sale price
- Current annual tax
- $572 · $48/mo
- Projected year-2 tax
- $572 · $48/mo
- Expected delta
- $0/yr ($0/mo · 0.0%)
ⓘ Screening estimate from a state-policy table — verify with the county assessor before closing.
Climate risk First Street
- Flood 1/10 Low FEMA zone X (unshaded) · 0% chance over 30 yrs
- Wildfire 4/10 Moderate
- Heat 4/10 Moderate 7 d/yr ≥106°F today · 19 d/yr by 30 yrs out
- Wind 2/10 Low
- Air quality 2/10 Low 1 unhealthy d/yr today · 1 by 30 yrs out
Nearby sold comps map
Loading sold comps map…
Walkable amenities ~0.75 mi
Loading nearby amenities…
Taxation est. · year 1
- Rental income
- $11,976
- − Mortgage interest
- −$2,185
- − Property taxes
- −$572
- − Insurance
- −$195
- − Repairs & maintenance
- −$958
- − Management
- −$958
- − Depreciation
- −$1,135
- Taxable income
- $5,974
- Est. tax owed @ 24.0%
- −$1,434
- After-tax cash flow
- $4,807/yr
For passive investors: Depreciation is non-cash, so a rental often shows a tax loss while cash-flowing — sheltering income. Rental losses are passive: they offset passive income freely, and up to $25,000/yr can offset ordinary (W-2) income if you actively participate and your MAGI is under $100k (phasing out to $0 by $150k); unused losses carry forward. On sale, claimed depreciation is recaptured at up to 25%, and gains may owe capital-gains tax (a 1031 exchange can defer both). Figures are a year-1 estimate at your 24.0% rate — not tax advice; consult a CPA.
Schools (NCES district)
- District
- Fulton 58
- NCES district ID
- 2912550
- Math proficiency
- 36% ▼ -1.00%
- Reading proficiency
- 42% ▼ -4.00%
- Median HH income
- $46,431
- Composite
- 33.31/100
- National rank
- #5504
- State rank
- #158 of 324 in MO
Livability — Fulton
- Score
- 71/100
- State rank
- #115
- US rank
- #7204
Category grades
Schools grade is shown separately in the Schools card above.
Census & demographics
- Census place
- Fulton, MO
- County
- Callaway County · 22,579 people
- City population
- 22,579
- Metro
- Jefferson City, MO
- Population (ZIP)
- 22,579
- Household income
- $63,072
- Rent vs Own
- Severe rent burden
- 551.0
Population outlook (Callaway County) Hauer SSP2
- Today (2025)
- 45,390 people
- By 2030
- 45,493 · +0.2%
- By 2040
- 45,092 · -0.7%
- By 2050
- 44,069 · -2.9%
- By 2075
- 41,875 · -7.7%
- By 2100
- 38,094 · -16.1%
Race, ethnicity, and origin ACS 2023
- Neighborhood character
- Predominantly White (86%)
- Race & ethnicity
- White 86% Two or more races 6% Black 5% Hispanic / Latino 3%
- Common ancestry
- Italian 5% Lithuanian 3% Serbian 2%
- Foreign-born
- 1% · Canada
- Languages at home
- 98% English-only · Spanish 1%
Political lean MEDSL · Callaway
- 2024 margin
- Solid R (+43.3) · D 27.6% · R 70.9% · Other 1.5%
- 2008→2024 swing
- -23.6pp toward R · 2008: -19.7pp · 2024: -43.3pp
- All cycles
- 2024: R+43.3 2020: R+42.3 2016: R+42.2 2012: R+31.1 2008: R+19.7
Not yet ingested
- Civics
- —
Market trends
- HPI YoY
- ▼ -119.33%
- Current HPI
- 205.5205
- Rent YoY
- —
- Metro
- Jefferson City, MO
- State GDP YoY
- ▲ 1.84%
- F500 in state
- 20
Industry mix (Fortune 500 HQ in MO)
| Industry | F500 HQs | Revenue |
|---|---|---|
| Healthcare | 1 | $163B |
|
||
| Insurance | 1 | $21B |
|
||
| Industrial Technology | 1 | $17B |
|
||
| Retail | 1 | $16B |
|
||
| Industrial Distribution | 1 | $10B |
|
||
| Utilities | 1 | $9B |
|
||
Price history
+0.0% since first listed6 events — show timeline
- 2026-06-04 Sold (MLS) — HMMLS
- 2026-06-03 Sold (MLS) — CBORMLS
- 2026-05-06 Delisted — HMMLS
- 2026-05-06 Pending — CBORMLS
- 2026-04-24 Listed $39,000 CBORMLS
- 2026-04-24 Listed $39,000 HMMLS
Property tax history
+7.1%/yrLatest (2025): $572 · -84.4% YoY. Source: county tax records.
Cash-flow waterfall
monthlySold comps — $/sqft
last 12 mo · ≤1 miLoading sold comps…