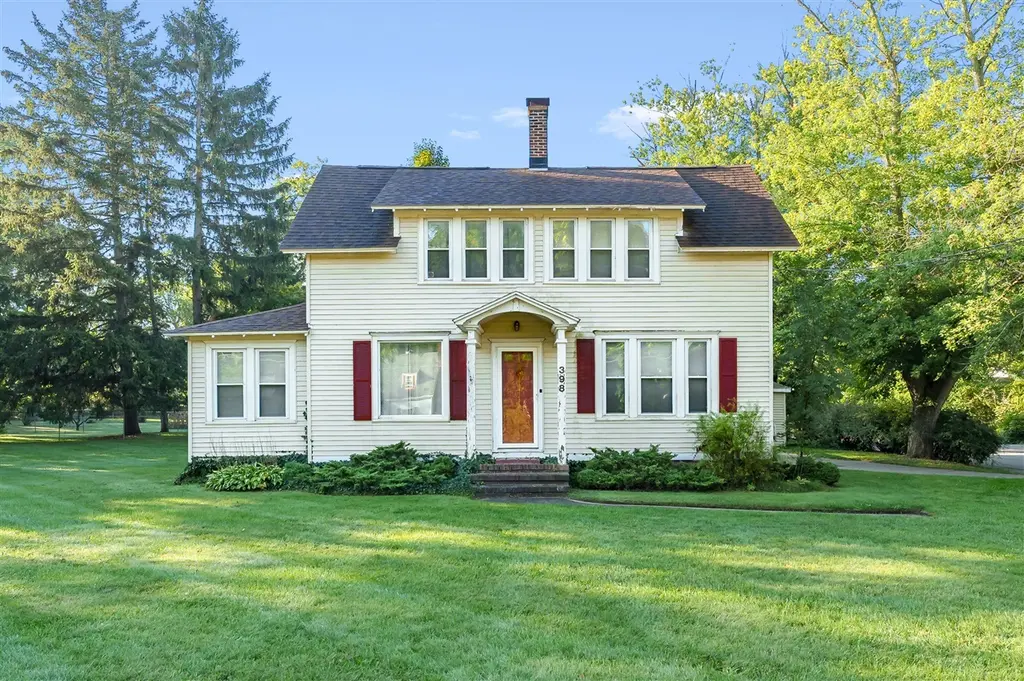
398 W Napier Ave
St. Joseph, MI 49022
$279,000F
3 bd · 1.5 ba ·
1,364 sqft ·
Built 1913
· SingleFamily
· Active
· 30 DOM
Cashflow @ list (25.0% down · 7.5%)
Estimated rent
$900/mo
Mortgage (P&I)
−$1,463
Tax + insurance
−$278
HOA
−$0
Vac / Maint / Mgmt
−$189
Net cashflow
$-1,030/mo
Annual
$-12,356/yr
Cap rate
1.86%
Cash-on-cash
-15.82%
DSCR
0.30
1% rule
0.32%
Cash to close
$78,120
Investor read
- This is a 3-bed/1.5-bath single-family listed at $279k.
- At list price, monthly cash flow is $-1k ($-12k/yr) — negative.
- To cash-flow at today's rent, offer at most $97k (65.2% below list).
- To meet the 1% rule (rent ≥ 1% of price), the offer needs to be $90k (67.7% below list).
- It's been on market 30 days — a 2% lower offer ($275k) is reasonable based on typical stale-listing flexibility.
- Recommended offer: $90k (67.7% below list) — sets the bar for 1% rule.
- Local home prices are declining (-3.0%/yr); year-one equity from $2k of loan paydown is wiped out by about $8k of value loss. Plan a longer hold.
- Location reads: area grade F — affects rentability + tenant quality, not the cash-flow math above.
- Benton Harbor Area Schools (urban): math 4% / reading 7% proficiency, ranked #732 of 760 in MI (top 96%) — low school quality limits family demand, transient renter base, plan for 1-2y turnover; 89% free/reduced lunch — lower-income household profile, screen leases tightly.
- Zoned schools: Fair Plain Middle School (math 0% / reading 4%, grade F, #493 of 493 statewide, top 100%, 288 students, 97% FRL); Fair Plain Middle School (math 0% / reading 4%, grade F, #493 of 493 statewide, top 100%, 288 students, 97% FRL); Benton Harbor High School (math 5% / reading 5%, grade F, #704 of 713 statewide, top 100%, 495 students, 97% FRL).
- Watch-outs: built in 1913 — expect roof / HVAC / electrical / plumbing capex.
- Market conditions: 184 active listings in the ZIP; 1 comparable units currently listed for rent nearby; 397 units permitted in Berrien County in 2024 (40 in 5+ unit buildings).
- Berrien County population projected at -16% by 2050 — secular population decline; favor cash flow + early exit over multi-decade hold.
- 32 sale attempts since 32y ago with the ask held roughly flat each time — persistent listings suggest the price (not the market) is what's stuck; bring a comps-based counter.
- Current owner paid $128k; list at $279k implies a 117% gain — meaningful room to come down on a strong offer.
- Cap rate 1.9% vs local median 3.0% in St. Joseph — below-typical yield; the buyer is paying a premium for something (appreciation thesis, condition, location) that the cap rate doesn't capture.
Questions for listing agent
- What do current leases actually rent for vs. the listed asking? Can we see a recent rent roll and the last 12 months of T-12 income?
- Built in 1913 — when were the roof, HVAC, electrical panel, plumbing, and water heater last replaced?
- Is there a deadline driving the sale (1031 exchange, divorce, estate, relocation)? That informs how much negotiation room exists.
- The area grade is low — what's the realistic commute time and amenity access for the typical tenant pool here? Any planned neighborhood developments (good or bad) we should know about?
- What's the average days-on-market for RENTAL listings here right now (not sales)? A rising rental-DOM trend means longer vacancies and softer asking-rent achievability than the comps imply.
- What's the recent tenant-quality profile in this submarket — average credit score on applications, eviction rate, late-payment / NSF rate, and stable-employment percentage? A property-management company in the area should have these aggregated.
- How much new for-sale + rental construction is in the pipeline within 1–3 miles? Heavy new supply typically softens prices + rents 12–24 months out; constrained supply supports both.
CashFlowRE · CFR-XQY6X59A2B3RSG
· Data 5 h ago
cashflowre.app · 2026-05-29