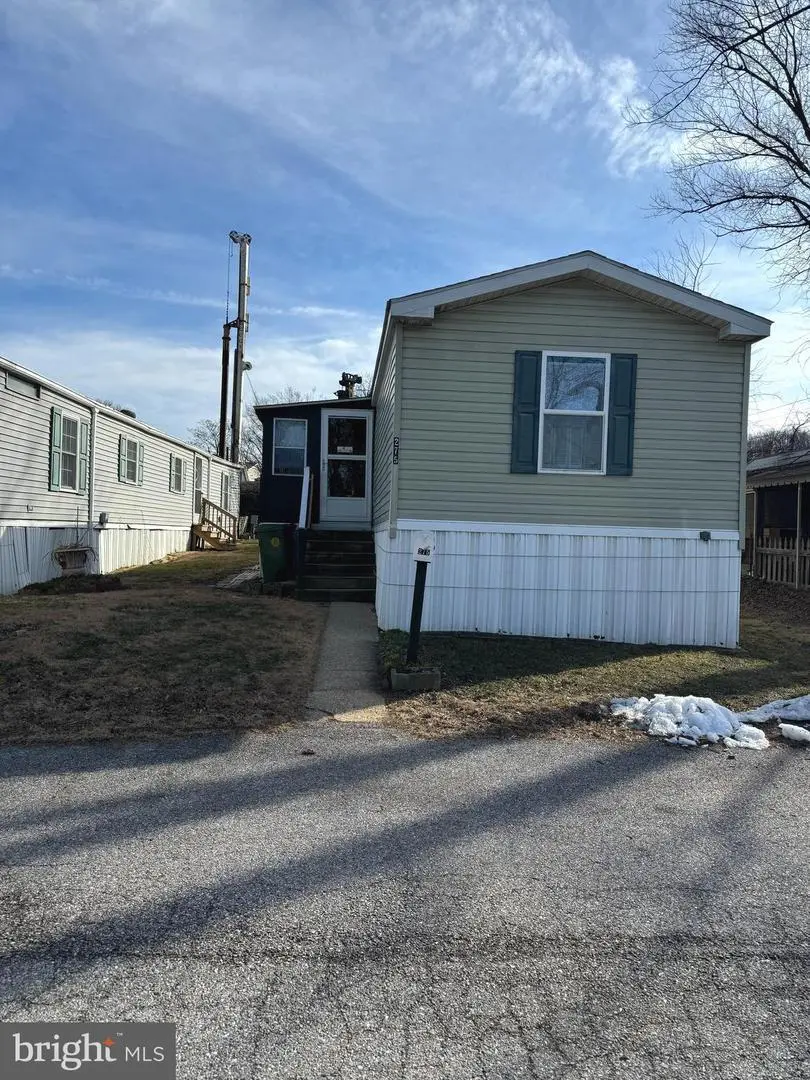
275 Rupert Cir
Brooklyn Park, MD 21225
$75,000B-
2 bd · 2.0 ba ·
891 sqft ·
Built 2006
· SingleFamily
· Active
· 93 DOM
Cashflow @ list (25.0% down · 7.5%)
Estimated rent
$1,605/mo
Mortgage (P&I)
−$393
Tax + insurance
−$125
HOA
−$0
Vac / Maint / Mgmt
−$337
Net cashflow
$750/mo
Annual
$9,000/yr
Cap rate
18.29%
Cash-on-cash
42.86%
DSCR
2.91
1% rule
2.14%
Cash to close
$21,000
Investor read
- This is a 2-bed/2.0-bath single-family listed at $75k. Condition is rated fair.
- At list price, monthly cash flow is $750 ($9k/yr) — positive.
- The deal already cash-flows at list — no discount required.
- Meets the 1% rule at list price ($2k rent vs $75k).
- It's been on market 93 days — a 9% lower offer ($68k) is reasonable based on typical stale-listing flexibility.
- Recommended offer: $68k (9.0% below list) — sets the bar for market timing.
- Local home prices are declining (-3.0%/yr); year-one equity from $519 of loan paydown is wiped out by about $2k of value loss. Plan a longer hold.
- Location reads 77/100 on livability (#81 in MD, #3,091 nationally) — a middle-class / working-renter tenant base. Strengths: commute A+, housing A+, health & safety A+; Watch: schools C-, crime F, amenities F.
- Anne Arundel County Public Schools (suburban): math 20% / reading 37% proficiency, ranked #10 of 24 in MD (top 42%) — low school quality limits family demand, transient renter base, plan for 1-2y turnover.
- Market conditions: Rents rising fast (+4.1%/yr); 165 active listings in the ZIP; 9 comparable units currently listed for rent nearby; rentals at typical pace (median 18d on market — plan ~3-4 weeks tenant-placement turnaround); 1,303 units permitted in Anne Arundel County in 2024 (299 in 5+ unit buildings).
- Anne Arundel County population projected at +17% by 2050 — long-run rental-demand tailwind backs the buy-and-hold thesis.
- At projected returns (-3.0% appreciation + 4.1% rent growth), your $21k cash investment doubles in ~3 years — after that, you're playing with house money.
- Cap rate 18.3% vs local median 4.4% in Brooklyn Park — top-decile yield for the area; either an underpriced asset or a hidden risk that comps aren't pricing in. Stress-test before assuming the spread holds.
- This rent runs 36% of the median local income ($54k/yr) — at the standard rent-burdened threshold; future hikes will face affordability resistance.
Questions for listing agent
- It's been on market 93 days. Have you received any prior offers? Is the seller open to a 9% concession, seller financing, or rate buy-down credit?
- Have any recent inspections been done? Can we get a copy of the seller's disclosures and any deferred-maintenance estimates?
- Why hasn't it sold? Are there any deal-killer items the seller is aware of (foundation, flood, title, zoning, code violations)?
- Is there a deadline driving the sale (1031 exchange, divorce, estate, relocation)? That informs how much negotiation room exists.
- Crime grade is F in this area — have there been break-ins, vandalism, or insurance claims at this property in the last 3 years? What carrier currently insures it and at what premium?
- What's the average days-on-market for RENTAL listings here right now (not sales)? A rising rental-DOM trend means longer vacancies and softer asking-rent achievability than the comps imply.
- What's the recent tenant-quality profile in this submarket — average credit score on applications, eviction rate, late-payment / NSF rate, and stable-employment percentage? A property-management company in the area should have these aggregated.
- How much new for-sale + rental construction is in the pipeline within 1–3 miles? Heavy new supply typically softens prices + rents 12–24 months out; constrained supply supports both.
Repairs flagged (vision-AI assessment)
- Major: exterior siding — Significant wear and tear
- Minor: interior paint — Some chipping and wear
CashFlowRE · CFR-XRWFS24KEDQVV0
· Data 2 days ago
cashflowre.app · 2026-05-29