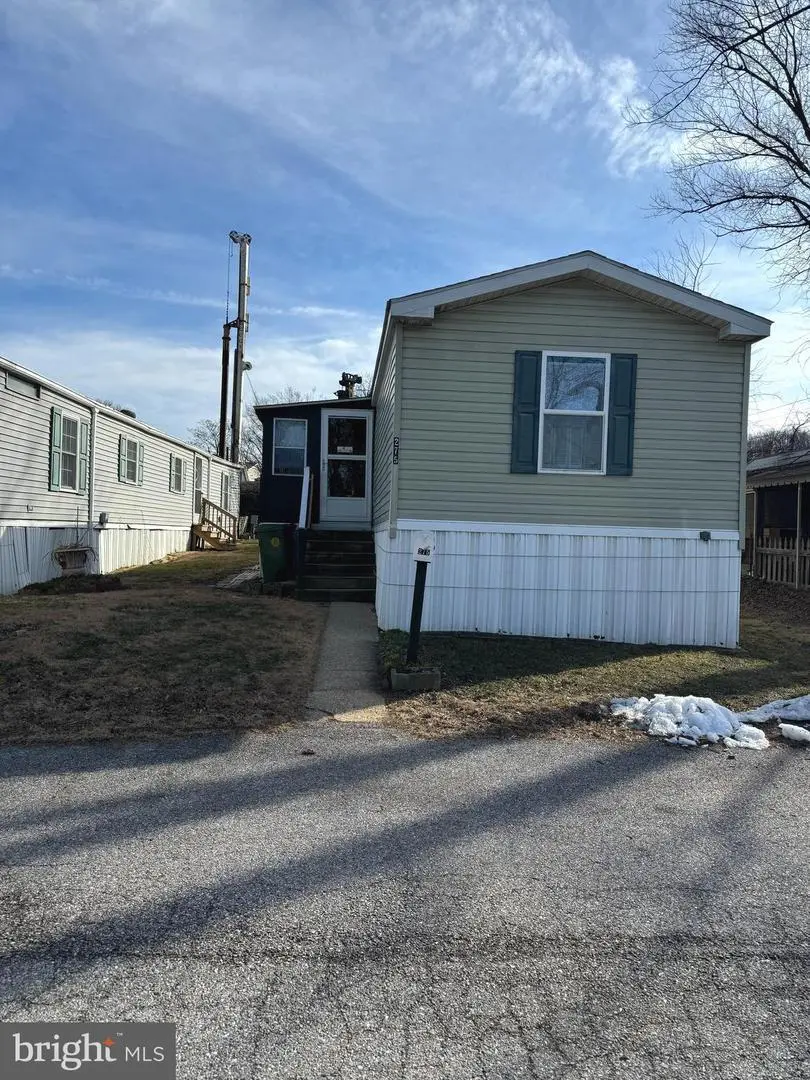
275 Rupert Cir · Brooklyn Park, MD
Flood risk No data
- FEMA flood zone
- —
- Chance of flooding over 30 yrs
- —
- Est. flood insurance / yr
- —
Fire risk No data
- Est. fire insurance / yr
- —
Heat risk No data
- Hot days now (above threshold)
- —
- Hot days in 30 yrs
- —
Wind risk No data
- Chance of severe wind over 30 yrs
- —
Air-quality risk No data
- Unhealthy air days now
- —
- Unhealthy air days in 30 yrs
- —
Risk factors via First Street. Map © Google.
Why this score? — see what drove the B- grade
The composite is a weighted blend of 9 inputs, each scored 0–100. Each bar is that input's sub-score; the figure is the points it added to the 100-point composite (weight × sub-score).
- Cash flow +30.0/30.0
- 1% rule +10.0/10.0
- DSCR +10.0/10.0
- ARV discount +7.5/15.0
- Livability +3.9/5.0
- Rent growth +3.5/5.0
- Schools +2.9/10.0
- Condition / age +2.2/5.0
- Appreciation +0.0/10.0
$75,000
🖨 Deal sheet 📄 Offer letter ✓ Due diligence
Listing remarks MLS
Welcome to 275 Rupert Circle situated in a Mobile Home Community consisting of mixed unit types including Mobile Homes and Manufactured Housing. This home is a Manufactured Home built in 2006 with a registered HUD Data Plate, and provides many options to it's new owner, including potential financing options available. Currently the home where it sits pays Ground Lease to remain in the park; however, due to the nature of the build, this home allows the extraordinary benefit of the new owner to transport the home to any deeded land location they desire. This well-maintained home is very clean, habitable and move-in ready, or rent-ready. Utilities and systems have been thoroughly maintained. Please reach out to the Listing Agent for any additional information for further assistance.
Key facts
- Built 2006
- Listed 93 days
Neighborhood map
What this means for you Summary
Snapshot
- This is a 2-bed/2.0-bath single-family listed at $75k. Condition is rated fair.
Deal economics
- At list price, monthly cash flow is $750 ($9k/yr) — positive.
- The deal already cash-flows at list — no discount required.
- Meets the 1% rule at list price ($2k rent vs $75k).
- Recommended offer: $68k (9.0% below list) — sets the bar for market timing.
- Cap rate 18.3% vs local median 4.4% in Brooklyn Park — top-decile yield for the area; either an underpriced asset or a hidden risk that comps aren't pricing in. Stress-test before assuming the spread holds.
Location & tenants
- Location reads 77/100 on livability (#81 in MD, #3,091 nationally) — a middle-class / working-renter tenant base. Strengths: commute A+, housing A+, health & safety A+; Watch: schools C-, crime F, amenities F.
- Anne Arundel County Public Schools (suburban): math 20% / reading 37% proficiency, ranked #10 of 24 in MD (top 42%) — low school quality limits family demand, transient renter base, plan for 1-2y turnover.
- Market conditions: Rents rising fast (+4.1%/yr); 165 active listings in the ZIP; 9 comparable units currently listed for rent nearby; rentals at typical pace (median 18d on market — plan ~3-4 weeks tenant-placement turnaround); 1,303 units permitted in Anne Arundel County in 2024 (299 in 5+ unit buildings).
- This rent runs 36% of the median local income ($54k/yr) — at the standard rent-burdened threshold; future hikes will face affordability resistance.
Forward outlook
- Local home prices are declining (-3.0%/yr); year-one equity from $519 of loan paydown is wiped out by about $2k of value loss. Plan a longer hold.
- Anne Arundel County population projected at +17% by 2050 — long-run rental-demand tailwind backs the buy-and-hold thesis.
- At projected returns (-3.0% appreciation + 4.1% rent growth), your $21k cash investment doubles in ~3 years — after that, you're playing with house money.
Negotiation context
- It's been on market 93 days — a 9% lower offer ($68k) is reasonable based on typical stale-listing flexibility.
Questions for the listing agent
- It's been on market 93 days. Have you received any prior offers? Is the seller open to a 9% concession, seller financing, or rate buy-down credit?
- Have any recent inspections been done? Can we get a copy of the seller's disclosures and any deferred-maintenance estimates?
- Why hasn't it sold? Are there any deal-killer items the seller is aware of (foundation, flood, title, zoning, code violations)?
- Is there a deadline driving the sale (1031 exchange, divorce, estate, relocation)? That informs how much negotiation room exists.
- Crime grade is F in this area — have there been break-ins, vandalism, or insurance claims at this property in the last 3 years? What carrier currently insures it and at what premium?
- What's the average days-on-market for RENTAL listings here right now (not sales)? A rising rental-DOM trend means longer vacancies and softer asking-rent achievability than the comps imply.
- What's the recent tenant-quality profile in this submarket — average credit score on applications, eviction rate, late-payment / NSF rate, and stable-employment percentage? A property-management company in the area should have these aggregated.
- How much new for-sale + rental construction is in the pipeline within 1–3 miles? Heavy new supply typically softens prices + rents 12–24 months out; constrained supply supports both.
Investment metrics
- 1% rule
- 2.14% ✓
- Cap rate
- 18.29%
- Cash-on-cash
- 42.86%
- DSCR
- 2.91
- GRM
- 3.9
CMA / ARV
- ARV (median comp)
- $266,326
- List price
- $75,000
- Delta
- -71.84%
- Verdict
- UNDERPRICED
- Comps
- 20 within 1.0 mi
Show comp detail 4 sales within ~0.75 mi
| Address | Dist | Beds/Ba | Sqft | Sold | Price | $/sf | Match |
|---|---|---|---|---|---|---|---|
| 5904-A Belle Grove Rd | 0.39mi | 3/1.0 (+1) | 945 (+6%) | 12mo | $305,000 | $323 | 53 |
| 227 Elizabeth Ave | 0.42mi | 3/1.0 (+1) | 960 (+8%) | 7mo | $248,000 | $258 | 52 |
| 309 17th Ave | 0.65mi | 3/2.0 (+1) | 960 (+8%) | 9mo | $315,000 | $328 | 45 |
| 308 17th Ave | 0.65mi | 3/2.0 (+1) | 960 (+8%) | 13mo | $357,500 | $372 | 41 |
Match score weights: distance 35% · size 25% · config 20% · recency 20%. Top-matched comps best support the ARV.
Projected returns pro-forma
-3.0% appreciation · 4.08% rent growth · sell at horizon
- IRR
- 40.9%
- Equity multiple
- 2.78×
- Total profit
- $37,404
- Equity at exit
- $11,183
- IRR
- 47.6%
- Equity multiple
- 5.84×
- Total profit
- $101,577
- Equity at exit
- $6,485
Cash invested: $21,000 (down + closing). Projections, not guarantees.
Landlord ↔ Tenant lean methodology
- Overall (STATE)
- 27 Tenant-Leaning
- State Maryland
- 27 Tenant-Leaning · D+14
- County
- — inherits STATE
- City
- — inherits STATE
ZIP-level market 21225
- Home prices YoY
- -31.9%
- Rents YoY
- 4.1%
- Active inventory
- 165
- Price-to-rent
- 3.9×
Monthly cashflow live
- Estimated rent
- $1,605 high interval (Pro) →
- Mortgage (P&I)
- −$393
- Tax est. 1.5%
- −$94 /mo · $1,125/yr
- Insurance
- −$31
- HOA
- −$0
- Vacancy / Maint / Mgmt
- −$337
- Net cashflow
- $750
Break-even live
UW: 25.0% down · 7.5% · 30yr · 1.5% tax · 5.0% vac · 8.0% maint · 8.0% mgmt
Financing live
Cash to close
- Down payment
- $18,750
- Closing costs
- $2,250
- Reserves months
- —
- Total cash needed
- —
Loan-product check · same deal, 3 products live
Conventional
25% down · 7.5% · 30yr
- Down + closing
- —
- Monthly P&I
- —
- Monthly cashflow
- —
- DSCR
- —
- Eligible?
- —
Personal DTI + credit; lowest rate.
DSCR
20% down · 8.5% · 30yr
- Down + closing
- —
- Monthly P&I
- —
- Monthly cashflow
- —
- DSCR
- —
- Eligible?
- —
No personal income docs; deal must DSCR.
Hard money
10% down · 12.0% · 12mo
- Down + closing
- —
- Monthly P&I
- —
- Monthly cashflow
- —
- DSCR
- —
- Eligible?
- —
Short-term bridge; refi at stabilization.
Rent comps 9 comps
| Address | Beds | Baths | Sqft | Rent | $/sqft | DOM | Units | Dist |
|---|---|---|---|---|---|---|---|---|
| 90 Hammonds Ln Brooklyn Park, MD | 1.0–2.0 | 1.0–2.0 | 757 | $1,964 | $2.59 | 1d | 4 | 0.85mi |
| 416 Hillview Dr Apt 201 Linthicum Heights, MD | 1.0–2.0 | 1.0–2.0 | 875 | $2,089 | $2.39 | 2d | 7 | 0.92mi |
| 205 Arundel Rd W Brooklyn, MD | 1.0 | 1.0 | 608 | $1,200 | $1.97 | 43d | 1 | 1.28mi |
| 1 Ballman Ct Unit 2 Baltimore, MD | 2.0 | 1.0 | 700 | $1,250 | $1.79 | 43d | 1 | 1.33mi |
| 217 W Edgevale Rd Brooklyn, MD | 3.0 | 1.5 | 992 | $1,800 | $1.81 | 23d | 1 | 1.38mi |
| 3010 Alabama Ave Halethorpe, MD | 2.0 | 1.0 | 900 | $2,200 | $2.44 | 17d | 1 | 1.39mi |
| 116-B Warwickshire Ln Glen Burnie, MD | 1.0–3.0 | 1.0–1.5 | 800 | $1,458 | $1.82 | 1d | 43 | 1.44mi |
| 4400 4th St Unit BASEMENT Baltimore, MD | 2.0 | 1.0 | 925 | $1,350 | $1.46 | 43d | 1 | 1.45mi |
| 4207 3rd St Unit 3 Brooklyn, MD | 2.0 | 1.0 | 850 | $1,595 | $1.88 | 4d | 1 | 1.45mi |
Listing history 15 events
-
2026-06-18days on market $75,000 Active 93 DOM
-
2026-06-17days on market $75,000 Active 92 DOM
-
2026-06-16days on market $75,000 Active 91 DOM
-
2026-06-15days on market $75,000 Active 90 DOM
-
2026-06-13days on market $75,000 Active 88 DOM
-
2026-06-09days on market $75,000 Active 84 DOM
-
2026-06-08days on market $75,000 Active 83 DOM
-
2026-06-07days on market $75,000 Active 82 DOM
-
2026-06-04days on market $75,000 Active 79 DOM
-
2026-06-03days on market $75,000 Active 78 DOM
-
2026-06-02days on market $75,000 Active 77 DOM
-
2026-06-01days on market $75,000 Active 76 DOM
-
2026-05-31days on market $75,000 Active 75 DOM
-
2026-03-18$75,000 Active 790-char remark
Show marketing remark (790 chars)
Welcome to 275 Rupert Circle situated in a Mobile Home Community consisting of mixed unit types including Mobile Homes and Manufactured Housing. This home is a Manufactured Home built in 2006 with a registered HUD Data Plate, and provides many options to it's new owner, including potential financing options available. Currently the home where it sits pays Ground Lease to remain in the park; however, due to the nature of the build, this home allows the extraordinary benefit of the new owner to transport the home to any deeded land location they desire. This well-maintained home is very clean, habitable and move-in ready, or rent-ready. Utilities and systems have been thoroughly maintained. Please reach out to the Listing Agent for any additional information for further assistance.
-
2026-03-14historical $75,000 790-char remark
Show marketing remark (790 chars)
Welcome to 275 Rupert Circle situated in a Mobile Home Community consisting of mixed unit types including Mobile Homes and Manufactured Housing. This home is a Manufactured Home built in 2006 with a registered HUD Data Plate, and provides many options to it's new owner, including potential financing options available. Currently the home where it sits pays Ground Lease to remain in the park; however, due to the nature of the build, this home allows the extraordinary benefit of the new owner to transport the home to any deeded land location they desire. This well-maintained home is very clean, habitable and move-in ready, or rent-ready. Utilities and systems have been thoroughly maintained. Please reach out to the Listing Agent for any additional information for further assistance.
ⓘ Source: listings_history table (triggers on properties + properties_extension) + one-shot
backfill from property_details.listing_events for pre-trigger history.
Nearby sold comps map
Loading sold comps map…
Walkable amenities ~0.75 mi
Loading nearby amenities…
Taxation est. · year 1
- Rental income
- $19,266
- − Mortgage interest
- −$4,201
- − Property taxes
- −$1,125
- − Insurance
- −$375
- − Repairs & maintenance
- −$1,541
- − Management
- −$1,541
- − Depreciation
- −$2,182
- Taxable income
- $8,300
- Est. tax owed @ 24.0%
- −$1,992
- After-tax cash flow
- $7,008/yr
For passive investors: Depreciation is non-cash, so a rental often shows a tax loss while cash-flowing — sheltering income. Rental losses are passive: they offset passive income freely, and up to $25,000/yr can offset ordinary (W-2) income if you actively participate and your MAGI is under $100k (phasing out to $0 by $150k); unused losses carry forward. On sale, claimed depreciation is recaptured at up to 25%, and gains may owe capital-gains tax (a 1031 exchange can defer both). Figures are a year-1 estimate at your 24.0% rate — not tax advice; consult a CPA.
Condition & rehab AI · 12 photos
This mobile home is move-in ready with cosmetic updates needed to enhance its curb appeal and value.
Repairs flagged
- Major exterior siding — Significant wear and tear
- Minor interior paint — Some chipping and wear
Value-add opportunities
- Both Paint exterior — Enhances curb appeal and value
- Both Replace carpet — Improves comfort and value
- Both Update kitchen appliances — Modernizes and increases value
- Both Update bathrooms — Modernizes and increases value
Renovation cost estimate screening
| Repair item | Severity | Est. cost |
|---|---|---|
| exterior siding · Significant wear and tear | Major | $15,000–50,000 |
| interior paint · Some chipping and wear | Minor | $500–3,000 |
| Total estimated repair cost · 2 items | $15,500–53,000 |
Value-add ROI direction
- Both Paint exterior — Enhances curb appeal and value ↑
- Both Replace carpet — Improves comfort and value ↑
- Both Update kitchen appliances — Modernizes and increases value ↑
- Both Update bathrooms — Modernizes and increases value ↑
ⓘ Cost ranges are severity-bucket heuristics (US national rule-of-thumb). Get contractor quotes + a written scope before underwriting a rehab budget.
Schools (NCES district)
- District
- Anne Arundel County Public Schools
- NCES district ID
- 2400060
- Math proficiency
- 20% ▼ -21.00%
- Reading proficiency
- 37% ▼ -13.00%
- Median HH income
- $87,880
- Composite
- 28.52/100
- National rank
- #6733
- State rank
- #10 of 24 in MD
Livability — Brooklyn Park
- Score
- 77/100
- State rank
- #81
- US rank
- #3091
Category grades
Schools grade is shown separately in the Schools card above.
Census & demographics
- Census place
- Brooklyn Park, MD
- County
- Anne Arundel County · 535,653 people
- City population
- 588,727
- Metro
- Baltimore-Columbia-Towson, MD
- Population (ZIP)
- 34,062
- Household income
- $54,020
- Rent vs Own
- Severe rent burden
- 1440.0
Population outlook (Anne Arundel County) Hauer SSP2
- Today (2025)
- 617,384 people
- By 2030
- 642,094 · +4.0%
- By 2040
- 686,621 · +11.2%
- By 2050
- 723,031 · +17.1%
- By 2075
- 809,346 · +31.1%
- By 2100
- 837,658 · +35.7%
Race, ethnicity, and origin ACS 2023
- Neighborhood character
- Diverse neighborhood (Simpson 0.68)
- Race & ethnicity
- Black 42% White 32% Hispanic / Latino 20% Two or more races 8% Native American 3% Asian 2%
- Hispanic origin (detail)
- Mexican 5% Puerto Rican 1%
- Common ancestry
- Romanian 2% Lithuanian 1% Iranian 1%
- Foreign-born
- 12% · Canada, China
- Languages at home
- 81% English-only · Spanish 16% Other Indo-European 1% French/Haitian/Cajun 1%
Political lean MEDSL · Anne Arundel
- 2024 margin
- D (+13.9) · D 55.7% · R 41.7% · Other 2.6%
- 2008→2024 swing
- +15.7pp toward D · 2008: -1.8pp · 2024: 13.9pp
- All cycles
- 2024: D+13.9 2020: D+14.5 2016: D+0.7 2012: R+0.9 2008: R+1.8
Not yet ingested
- Civics
- —
Market trends
- HPI YoY
- ▼ -119.44%
- Current HPI
- 254.5089
- Rent YoY
- ▲ 4.08%
- Metro
- Baltimore-Columbia-Towson, MD
- State GDP YoY
- ▲ 2.97%
- F500 in state
- 12
Industry mix (Fortune 500 HQ in MD)
| Industry | F500 HQs | Revenue |
|---|---|---|
| Aerospace / Defense | 1 | $71B |
|
||
| Utilities | 1 | $25B |
|
||
| Hotels | 1 | $24B |
|
||
| Consumer Goods | 1 | $7B |
|
||
| Real Estate | 1 | $6B |
|
||
| Chemicals | 1 | $2B |
|
||
Price history
+0.0% since first listed2 events — show timeline
- 2026-03-18 Listed $75,000 BRIGHT MLS
- 2026-03-14 Coming Soon $75,000 BRIGHT MLS
Cash-flow waterfall
monthlySold comps — $/sqft
last 12 mo · ≤1 miLoading sold comps…