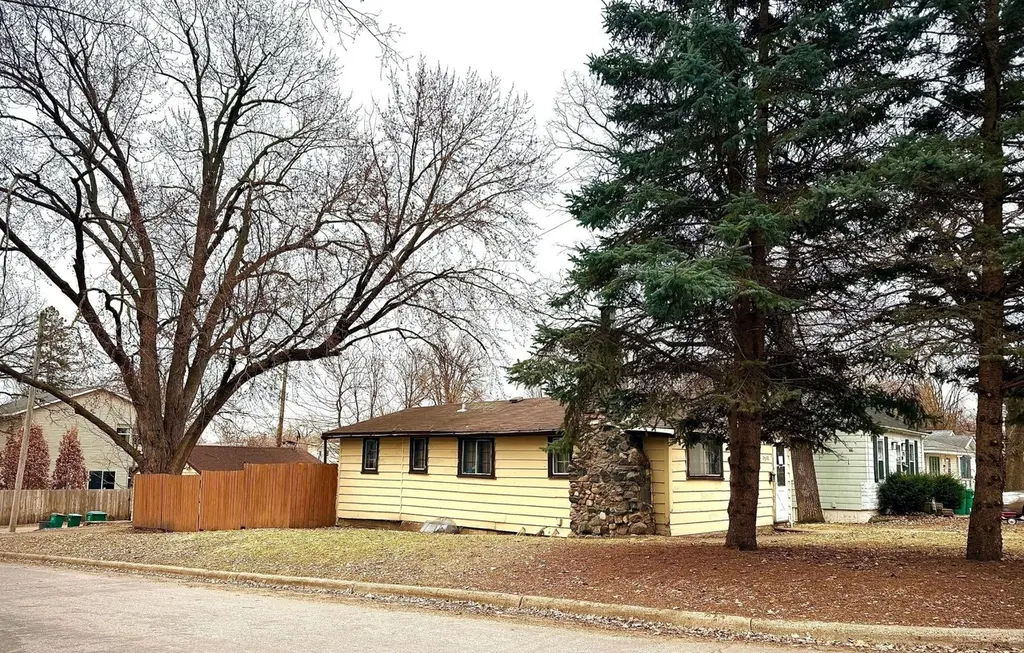
2701 Blackstone Ave S
St. Louis Park, MN 55416
$189,900D
2 bd · 1.0 ba ·
720 sqft ·
Built 1939
· SingleFamily
· Pending
· 12 DOM
Cashflow @ list (25.0% down · 7.5%)
Estimated rent
$1,760/mo
Mortgage (P&I)
−$996
Tax + insurance
−$321
HOA
−$0
Vac / Maint / Mgmt
−$370
Net cashflow
$74/mo
Annual
$886/yr
Cap rate
6.76%
Cash-on-cash
1.67%
DSCR
1.07
1% rule
0.93%
Cash to close
$53,172
Investor read
- This is a 2-bed/1.0-bath single-family listed at $190k.
- At list price, monthly cash flow is $74 ($886/yr) — positive.
- The deal already cash-flows at list — no discount required.
- To meet the 1% rule (rent ≥ 1% of price), the offer needs to be $176k (7.3% below list).
- Only 12 days on market — expect competitive offers; lowballing is unlikely to land.
- Recommended offer: $176k (7.3% below list) — sets the bar for 1% rule.
- Local home prices are declining (-3.0%/yr); year-one equity from $1k of loan paydown is wiped out by about $6k of value loss. Plan a longer hold.
- Location reads: area grade D — affects rentability + tenant quality, not the cash-flow math above.
- St. Louis Park Public School District (suburban): math 45% / reading 55% proficiency, ranked #100 of 301 in MN (top 33%) — acceptable for families but not a draw, mixed tenant base, ~2y average lease.
- Zoned schools: Park Spanish Immersion Elementary (math 62% / reading 63%, grade B, #173 of 857 statewide, top 21%, 530 students, 14% FRL); St. Louis Park Middle School (math 37% / reading 52%, grade D, #118 of 258 statewide, top 48%, 956 students, 40% FRL); St. Louis Park Senior High (math 52% / reading 67%, grade C+, #46 of 471 statewide, top 11%, 1,483 students, 43% FRL) — zoned schools at 32% FRL track the district average.
- Watch-outs: built in 1939 — expect roof / HVAC / electrical / plumbing capex.
- Market conditions: Rents rising (+2.3%/yr); 207 active listings in the ZIP; 40 comparable units currently listed for rent nearby; rentals leasing fast (median 1d on market — plan ~1-2 weeks tenant-placement turnaround); solid renter incomes; 4,651 units permitted in Hennepin County in 2024 (2,443 in 5+ unit buildings).
- Hennepin County population projected at +30% by 2050 — long-run rental-demand tailwind backs the buy-and-hold thesis.
- Current owner paid $32k; list at $190k implies a 484% gain — meaningful room to come down on a strong offer.
- Cap rate 6.8% vs local median 3.1% in St. Louis Park — top-decile yield for the area; either an underpriced asset or a hidden risk that comps aren't pricing in. Stress-test before assuming the spread holds.
Questions for listing agent
- Built in 1939 — when were the roof, HVAC, electrical panel, plumbing, and water heater last replaced?
- Is there a deadline driving the sale (1031 exchange, divorce, estate, relocation)? That informs how much negotiation room exists.
- The area grade is low — what's the realistic commute time and amenity access for the typical tenant pool here? Any planned neighborhood developments (good or bad) we should know about?
- What's the average days-on-market for RENTAL listings here right now (not sales)? A rising rental-DOM trend means longer vacancies and softer asking-rent achievability than the comps imply.
- What's the recent tenant-quality profile in this submarket — average credit score on applications, eviction rate, late-payment / NSF rate, and stable-employment percentage? A property-management company in the area should have these aggregated.
- How much new for-sale + rental construction is in the pipeline within 1–3 miles? Heavy new supply typically softens prices + rents 12–24 months out; constrained supply supports both.
CashFlowRE · CFR-XSGTEV1JXRN1JQ
· Data 4 weeks ago
cashflowre.app · 2026-05-29