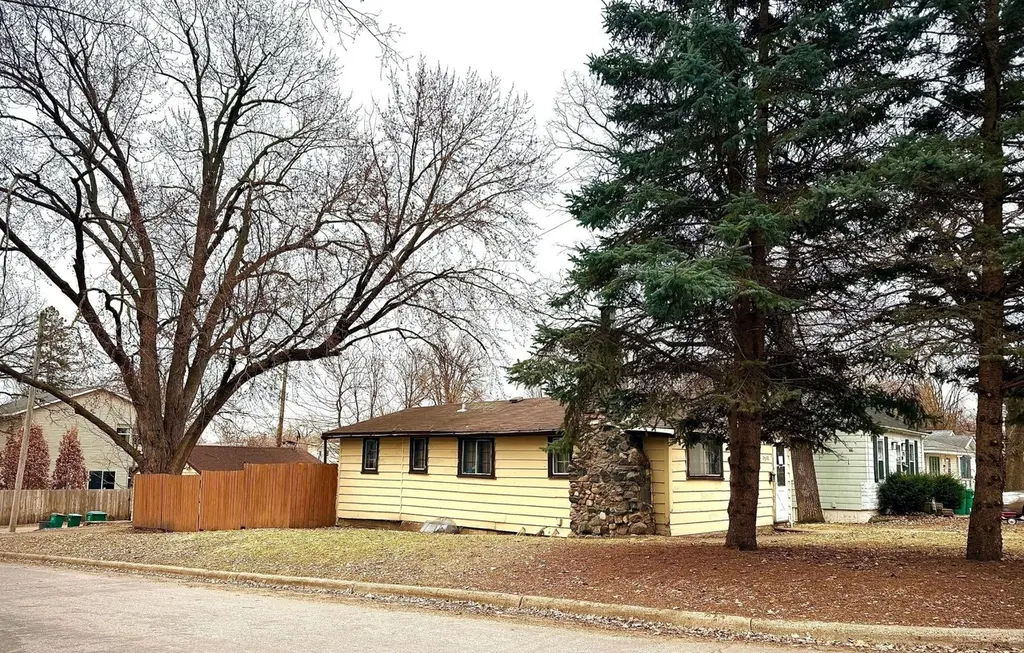
2701 Blackstone Ave S · St. Louis Park, MN
Flood risk 1/10 · Minimal
- FEMA flood zone
- X (unshaded)
- Chance of flooding over 30 yrs
- 0.0%
- Est. flood insurance / yr
- $507 – $1,088
Fire risk 1/10 · Minimal
- Est. fire insurance / yr
- $888 – $1,650
Heat risk 2/10 · Minimal
- Hot days now (above 99°F)
- 7 days/yr
- Hot days in 30 yrs
- 14 days/yr
Wind risk 2/10 · Minimal
- Chance of severe wind over 30 yrs
- —
Air-quality risk 2/10 · Minimal
- Unhealthy air days now
- 2 days/yr
- Unhealthy air days in 30 yrs
- 2 days/yr
Risk factors via First Street. Map © Google.
Why this score? — see what drove the D grade
The composite is a weighted blend of 9 inputs, each scored 0–100. Each bar is that input's sub-score; the figure is the points it added to the 100-point composite (weight × sub-score).
- Cash flow +15.4/30.0
- ARV discount +7.5/15.0
- DSCR +4.7/10.0
- Schools +4.4/10.0
- 1% rule +4.3/10.0
- Rent growth +3.1/5.0
- Livability +2.5/5.0
- Condition / age +2.5/5.0
- Appreciation +0.0/10.0
$189,900
🖨 Deal sheet (PDF) 📄 Offer letter ✓ Due diligence
Listing remarks
Remodeling & Flipping or Custom-Built OPPORTUNITY is here! Property is situated on a corner lot in the heart of St. Louis Park. This One-Story-Home, with a walk-out basement and a two-car garage, has two bedrooms and a full bathroom on the main level. This is being sold AS-IS. This OPPORTUNITY would make for a beautiful home or great investment property in a prime location, near Knollwood Mall, Texa-Tonka Shopping Center and West End. If you are looking for a deep-long-corner-lot home in an excellent location, this is The One - A Rare Opportunity!
Key facts
- 5,227 sq ft lot
- 2 garage spots
- Built 1939
Property features AI
Finance
- Financial info: Property is owned free and clear
Exterior
- Parking: Detached or attached 2-car garage with 22x20 dimensions
- Utilities: City water connected; City sewer connected; Natural gas
- Home design: Residential property; One-story (main level living); Main-level entry
- Construction: Block construction; Asphalt roof (over 8 years old); Block unfinished basement
- Exterior features: Corner lot with medium tree coverage; Partial wood fencing; Paved street frontage; Walkout basement
Interior
- Kitchen: Eat-in kitchen (kitchen/dining room)
- Bedrooms: Two bedrooms on the main level
- Bathrooms: One full bathroom on the main floor
- Heating & cooling: Forced air heating; Wall-mounted cooling unit(s)
- Interior features: Main-floor primary and bedrooms; Dining area combined with kitchen; Wood-burning fireplace (1)
- Laundry & utility: Laundry located in the basement
Neighborhood map
What this means for you Summary
Snapshot
- This is a 2-bed/1.0-bath single-family listed at $190k.
Deal economics
- At list price, monthly cash flow is $74 ($886/yr) — positive.
- The deal already cash-flows at list — no discount required.
- To meet the 1% rule (rent ≥ 1% of price), the offer needs to be $176k (7.3% below list).
- Recommended offer: $176k (7.3% below list) — sets the bar for 1% rule.
- Cap rate 6.8% vs local median 3.1% in St. Louis Park — top-decile yield for the area; either an underpriced asset or a hidden risk that comps aren't pricing in. Stress-test before assuming the spread holds.
Location & tenants
- Location reads: area grade D — affects rentability + tenant quality, not the cash-flow math above.
- St. Louis Park Public School District (suburban): math 45% / reading 55% proficiency, ranked #100 of 301 in MN (top 33%) — acceptable for families but not a draw, mixed tenant base, ~2y average lease.
- Zoned schools: Park Spanish Immersion Elementary (math 62% / reading 63%, grade B, #173 of 857 statewide, top 21%, 530 students, 14% FRL); St. Louis Park Middle School (math 37% / reading 52%, grade D, #118 of 258 statewide, top 48%, 956 students, 40% FRL); St. Louis Park Senior High (math 52% / reading 67%, grade C+, #46 of 471 statewide, top 11%, 1,483 students, 43% FRL) — zoned schools at 32% FRL track the district average.
- Market conditions: Rents rising (+2.3%/yr); 207 active listings in the ZIP; 40 comparable units currently listed for rent nearby; rentals leasing fast (median 1d on market — plan ~1-2 weeks tenant-placement turnaround); solid renter incomes; 4,651 units permitted in Hennepin County in 2024 (2,443 in 5+ unit buildings).
Forward outlook
- Local home prices are declining (-3.0%/yr); year-one equity from $1k of loan paydown is wiped out by about $6k of value loss. Plan a longer hold.
- Hennepin County population projected at +30% by 2050 — long-run rental-demand tailwind backs the buy-and-hold thesis.
Negotiation context
- Only 12 days on market — expect competitive offers; lowballing is unlikely to land.
- Current owner paid $32k; list at $190k implies a 484% gain — meaningful room to come down on a strong offer.
Risks & watch-outs
- Watch-outs: built in 1939 — expect roof / HVAC / electrical / plumbing capex.
Questions for the listing agent
- Built in 1939 — when were the roof, HVAC, electrical panel, plumbing, and water heater last replaced?
- Is there a deadline driving the sale (1031 exchange, divorce, estate, relocation)? That informs how much negotiation room exists.
- The area grade is low — what's the realistic commute time and amenity access for the typical tenant pool here? Any planned neighborhood developments (good or bad) we should know about?
- What's the average days-on-market for RENTAL listings here right now (not sales)? A rising rental-DOM trend means longer vacancies and softer asking-rent achievability than the comps imply.
- What's the recent tenant-quality profile in this submarket — average credit score on applications, eviction rate, late-payment / NSF rate, and stable-employment percentage? A property-management company in the area should have these aggregated.
- How much new for-sale + rental construction is in the pipeline within 1–3 miles? Heavy new supply typically softens prices + rents 12–24 months out; constrained supply supports both.
Investment metrics
- 1% rule
- 0.93% ✗
- Cap rate
- 6.76%
- Cash-on-cash
- 1.67%
- DSCR
- 1.07
- GRM
- 9.0
CMA / ARV
No comps found within radius.
Projected returns pro-forma
-3.0% appreciation · 2.26% rent growth · sell at horizon
- IRR
- -14.5%
- Equity multiple
- 0.49×
- Total profit
- $-27,341
- Equity at exit
- $28,315
- IRR
- -7.0%
- Equity multiple
- 0.57×
- Total profit
- $-22,894
- Equity at exit
- $16,419
Cash invested: $53,172 (down + closing). Projections, not guarantees.
Landlord ↔ Tenant lean methodology
- Overall (STATE)
- 46 Balanced
- State Minnesota
- 46 Balanced · D+2
- County
- — inherits STATE
- City
- — inherits STATE
ZIP-level market 55416
- Rents YoY
- 2.3%
- Active inventory
- 207
- Price-to-rent
- 9.0×
Monthly cashflow live
- Estimated rent
- $1,760 high interval (Pro) →
- Mortgage (P&I)
- −$996
- Tax from tax record
- −$242 /mo · $2,900/yr
- Insurance
- −$79
- HOA
- −$0
- Vacancy / Maint / Mgmt
- −$370
- Net cashflow
- $74
Break-even live
Sensitivity live
| Price | -10% $181 | -5% $128 | +0% $74 | +5% $20 | +10% $-34 |
|---|---|---|---|---|---|
| Rent | -10% $-65 | -5% $4 | +0% $74 | +5% $143 | +10% $213 |
| Rate | -1.0pp $169 | -0.5pp $122 | base $74 | +0.5pp $25 | +1.0pp $-25 |
UW: 25.0% down · 7.5% · 30yr · 1.5% tax · 5.0% vac · 8.0% maint · 8.0% mgmt
Financing live
Cash to close
- Down payment
- $47,475
- Closing costs
- $5,697
- Reserves months
- —
- Total cash needed
- —
Loan-product check · same deal, 3 products live
Conventional
25% down · 7.5% · 30yr
- Down + closing
- —
- Monthly P&I
- —
- Monthly cashflow
- —
- DSCR
- —
- Eligible?
- —
Personal DTI + credit; lowest rate.
DSCR
20% down · 8.5% · 30yr
- Down + closing
- —
- Monthly P&I
- —
- Monthly cashflow
- —
- DSCR
- —
- Eligible?
- —
No personal income docs; deal must DSCR.
Hard money
10% down · 12.0% · 12mo
- Down + closing
- —
- Monthly P&I
- —
- Monthly cashflow
- —
- DSCR
- —
- Eligible?
- —
Short-term bridge; refi at stabilization.
Rent comps 40 comps
| Address | Beds | Baths | Sqft | Rent | $/sqft | DOM | Units | Dist |
|---|---|---|---|---|---|---|---|---|
| 2524 Minneapolis, MN | 1.0–2.0 | 1.0 | 700 | $1,550 | $2.21 | 14d | 5 | 0.44mi |
| 2524 Minnesota 100 Unit 2514-0513 St Louis Park, MN | 1.0 | 1.0 | 450 | $1,299 | $2.89 | 5d | 1 | 0.49mi |
| 2524 Minnesota 100 Unit 2514-0533 St Louis Park, MN | 1.0 | 1.0 | 450 | $1,299 | $2.89 | 46d | 1 | 0.49mi |
| 2480 Highway 100 S Minneapolis, MN | 1.0–2.0 | 1.0 | 755 | $1,395 | $1.85 | 4d | 2 | 0.50mi |
| 5621 Minnetonka Blvd Minneapolis, MN | 1.0–2.0 | 1.0 | 800 | $1,509 | $1.89 | 14d | 2 | 0.52mi |
| 3000 Highway 100 S Minneapolis, MN | 1.0–2.0 | 1.0–1.5 | 867 | $1,475 | $1.70 | 17d | 3 | 0.61mi |
| 6800 Cedar Lake Rd S Minneapolis, MN | 1.0–3.0 | 1.0–2.0 | 1017 | $2,465 | $2.42 | 0d | 10 | 0.72mi |
| 5108 Minnetonka Blvd Unit 805 St Louis Park, MN | 1.0 | 1.0 | 675 | $1,095 | $1.62 | 46d | 1 | 0.75mi |
| 5108 Minnetonka Blvd Unit 802 St Louis Park, MN | 1.0 | 1.0 | 675 | $1,225 | $1.81 | 46d | 1 | 0.75mi |
| 8224 W 30th ST Golden Valley, MN | 2.0 | 1.0–1.5 | 875 | $1,625 | $1.86 | 4d | 27 | 0.81mi |
| 29XX Nevada Ave S St Louis Park, MN | 1.0–2.0 | 1.0 | 865 | $1,550 | $1.79 | 7d | 19 | 0.84mi |
| 4505 W 36th St St Louis Park, MN | 1.0 | 1.0 | 700 | $1,269 | $1.81 | 0d | 4 | 0.85mi |
| 1427 Colorado Ave S Minneapolis, MN | 1.0–2.0 | 1.0 | 800 | $1,599 | $2.00 | 0d | 9 | 0.92mi |
| 1425 Colorado Ave S Unit 1427-218 St Louis Park, MN | 1.0 | 1.0 | 750 | $1,249 | $1.67 | 46d | 1 | 0.93mi |
| 4820 MN-7 St Louis Park, MN | 1.0–2.0 | 1.0–1.5 | 875 | $1,705 | $1.95 | 0d | 13 | 0.95mi |
| 4815 Cedar Lake Rd S Minneapolis, MN | 1.0 | 1.0 | 665 | $1,020 | $1.53 | 0d | 3 | 0.99mi |
| 7414 W 22nd St #112 Minneapolis, MN | 1.0 | 1.0 | 739 | $1,350 | $1.83 | 46d | 1 | 1.01mi |
| 5924 W 35th St Unit A Minneapolis, MN | 1.0 | 1.0 | 750 | $995 | $1.33 | 20d | 1 | 1.02mi |
| 1351 Hampshire Ave S Minneapolis, MN | 1.0–2.0 | 1.0 | 920 | $1,675 | $1.82 | 5d | 14 | 1.04mi |
| 5310 W 16th St Minneapolis, MN | 1.0–2.0 | 1.0–2.0 | 857 | $2,615 | $3.05 | 0d | 9 | 1.06mi |
| 5855 Highway 7 Minneapolis, MN | 3.0 | 1.0–2.0 | 991 | $2,562 | $2.58 | 0d | 37 | 1.07mi |
| 2235 Quebec Ave S Unit base Minneapolis, MN | 1.0 | 1.0 | 700 | $1,500 | $2.14 | 46d | 1 | 1.08mi |
| 4450 Minnetonka Blvd Minneapolis, MN | 1.0–2.0 | 1.0 | 1000 | $1,595 | $1.59 | 7d | 7 | 1.08mi |
| 5600 Camerata Way Minneapolis, MN | 1.0–2.0 | 1.0–2.0 | 1037 | $2,502 | $2.41 | 0d | 23 | 1.11mi |
| 2888 Joppa Ave S St Louis Park, MN | 1.0–2.0 | 1.0–1.5 | 900 | $1,595 | $1.77 | 0d | 14 | 1.12mi |
| 3016 Lynn Ave Apt 3B Minneapolis, MN | 1.0 | 1.0 | 650 | $1,075 | $1.65 | 0d | 1 | 1.13mi |
| 1511 Utica Ave S Minneapolis, MN | 3.0 | 1.0–2.5 | 970 | $3,140 | $3.24 | 0d | 10 | 1.14mi |
| 5235 Wayzata Blvd Minneapolis, MN | 2.0 | 1.0–2.0 | 997 | $3,762 | $3.77 | 0d | 13 | 1.15mi |
| 1325 Utica Ave S Minneapolis, MN | 3.0 | 1.0–2.0 | 1030 | $3,065 | $2.97 | 0d | 10 | 1.17mi |
| 7920 Minnetonka Blvd Minneapolis, MN | 2.0 | 1.0–2.0 | 865 | $2,902 | $3.35 | 0d | 14 | 1.20mi |
| 4300 Minnesota 7 St Louis Park, MN | 1.0–2.0 | 1.0 | 607 | $1,345 | $2.21 | 46d | 5 | 1.22mi |
| 901 Xenia Ave S Minneapolis, MN | 2.0 | 1.0–2.0 | 826 | $2,532 | $3.07 | 0d | 11 | 1.23mi |
| 3440 Belt Line Blvd Minneapolis, MN | 1.0 | 1.0 | 706 | $1,791 | $2.54 | 0d | 12 | 1.26mi |
| 4501 Park Glen Rd St Louis Park, MN | 2.0 | 1.0–2.0 | 797 | $2,300 | $2.89 | 0d | 24 | 1.29mi |
| 3510 Belt Line Blvd Minneapolis, MN | 1.0 | 1.0 | 809 | $2,254 | $2.78 | 0d | 8 | 1.30mi |
| 770 Xenia Ave S Minneapolis, MN | 2.0 | 1.0–2.0 | 894 | $2,955 | $3.31 | 0d | 29 | 1.31mi |
| 7201 Walker St Minneapolis, MN | 1.0–3.0 | 1.0–2.0 | 1078 | $2,114 | $1.96 | 0d | 21 | 1.34mi |
| 4301 Park Glen Rd Minneapolis, MN | 2.0 | 1.0–2.0 | 781 | $1,939 | $2.48 | 0d | 10 | 1.35mi |
| 3601 Park Center Blvd Minneapolis, MN | 1.0–2.0 | 1.0–2.0 | 942 | $2,406 | $2.55 | 0d | 20 | 1.35mi |
| 3055 Virginia Ave S St Louis Park, MN | 1.0 | 1.0 | 675 | $1,075 | $1.59 | 46d | 1 | 1.39mi |
Listing history 6 events
-
2026-04-22status Pending
-
2026-04-18price $189,900
-
2026-04-11$205,000 Active
-
2026-04-07historical $205,000
-
1979-09-01soldstatus $32,500
-
1973-03-01soldstatus $17,900
ⓘ Source: listings_history table (triggers on properties + properties_extension) + one-shot
backfill from property_details.listing_events for pre-trigger history.
Tax reassessment forecast MN · Partial reset (capped growth)
- Current annual tax
- $2,900 · $242/mo
- Projected year-2 tax
- $2,900 · $242/mo
- Expected delta
- $0/yr ($0/mo · 0.0%)
ⓘ Screening estimate from a state-policy table — verify with the county assessor before closing.
Climate risk First Street
- Flood 1/10 Low FEMA zone X (unshaded) · 0% chance over 30 yrs
- Wildfire 1/10 Low
- Heat 2/10 Low 7 d/yr ≥99°F today · 14 d/yr by 30 yrs out
- Wind 2/10 Low
- Air quality 2/10 Low 2 unhealthy d/yr today · 2 by 30 yrs out
Nearby sold comps map
Loading sold comps map…
Walkable amenities ~0.75 mi
Loading nearby amenities…
Taxation est. · year 1
- Rental income
- $21,121
- − Mortgage interest
- −$10,637
- − Property taxes
- −$2,900
- − Insurance
- −$950
- − Repairs & maintenance
- −$1,690
- − Management
- −$1,690
- − Depreciation
- −$5,524
- Taxable loss
- −$2,269
- Est. tax savings @ 24.0%
- +$545
- After-tax cash flow
- $1,431/yr
For passive investors: Depreciation is non-cash, so a rental often shows a tax loss while cash-flowing — sheltering income. Rental losses are passive: they offset passive income freely, and up to $25,000/yr can offset ordinary (W-2) income if you actively participate and your MAGI is under $100k (phasing out to $0 by $150k); unused losses carry forward. On sale, claimed depreciation is recaptured at up to 25%, and gains may owe capital-gains tax (a 1031 exchange can defer both). Figures are a year-1 estimate at your 24.0% rate — not tax advice; consult a CPA.
Schools (NCES district)
- District
- St. Louis Park Public School District
- NCES district ID
- 2733780
- Math proficiency
- 45% ▼ -8.00%
- Reading proficiency
- 55% ▼ -4.00%
- Median HH income
- $65,785
- Composite
- 44.26/100
- National rank
- #2840
- State rank
- #100 of 301 in MN
Livability — St. Louis Park
No livability data for this city. (Only ~50 U.S. cities are tracked.)
Census & demographics
- Census place
- St. Louis Park, MN
- County
- Hennepin County · 1,150,272 people
- City population
- 60,356
- Metro
- Minneapolis-St. Paul-Bloomington, MN-WI
- Population (ZIP)
- 35,015
- Household income
- $105,958
- Rent vs Own
- Severe rent burden
- 1213.0
Population outlook (Hennepin County) Hauer SSP2
- Today (2025)
- 1,405,227 people
- By 2030
- 1,492,650 · +6.2%
- By 2040
- 1,660,157 · +18.1%
- By 2050
- 1,823,498 · +29.8%
- By 2075
- 2,221,283 · +58.1%
- By 2100
- 2,509,976 · +78.6%
Race, ethnicity, and origin ACS 2023
- Neighborhood character
- Predominantly White (79%)
- Race & ethnicity
- White 79% Two or more races 9% Hispanic / Latino 8% Black 5% Asian 4%
- Hispanic origin (detail)
- Mexican 4%
- Common ancestry
- Portuguese 12% Romanian 5% Lithuanian 4%
- Foreign-born
- 8% · Canada, China, South Korea
- Languages at home
- 89% English-only · Spanish 4% Other Indo-European 1% Other Asian/Pacific 1%
Political lean MEDSL · Hennepin
- 2024 margin
- Solid D (+42.6) · D 70.2% · R 27.5% · Other 2.3%
- 2008→2024 swing
- +14.0pp toward D · 2008: 28.6pp · 2024: 42.6pp
- All cycles
- 2024: D+42.6 2020: D+43.2 2016: D+35.3 2012: D+27.1 2008: D+28.6
Not yet ingested
- Civics
- —
Market trends
- HPI YoY
- ▼ -490.63%
- Current HPI
- 230.651
- Rent YoY
- ▲ 2.26%
- Metro
- Minneapolis-St. Paul-Bloomington, MN-WI
- State GDP YoY
- ▲ 2.41%
- F500 in state
- 34
Industry mix (Fortune 500 HQ in MN)
| Industry | F500 HQs | Revenue |
|---|---|---|
| Healthcare | 2 | $407B |
|
||
| Retail | 2 | $150B |
|
||
| Consumer Goods | 2 | $32B |
|
||
| Industrial Machinery | 2 | $6B |
|
||
| Agriculture | 1 | $40B |
|
||
| Healthcare / Medical Devices | 1 | $32B |
|
||
Price history
+960.9% since first listed6 events — show timeline
- 2026-04-22 Pending — NORTHSTARMLS as Distributed by MLS Grid
- 2026-04-18 Price Changed $189,900 NORTHSTARMLS as Distributed by MLS Grid
- 2026-04-11 Listed $205,000 NORTHSTARMLS as Distributed by MLS Grid
- 2026-04-07 Coming Soon $205,000 NORTHSTARMLS as Distributed by MLS Grid
- 1979-09-01 Sold (Public Records) $32,500 Public Records
- 1973-03-01 Sold (Public Records) $17,900 Public Records
Property tax history
+3.1%/yrLatest (2025): $2,900 · +1.6% YoY. Source: county tax records.
Cash-flow waterfall
monthlySold comps — $/sqft
last 12 mo · ≤1 miLoading sold comps…