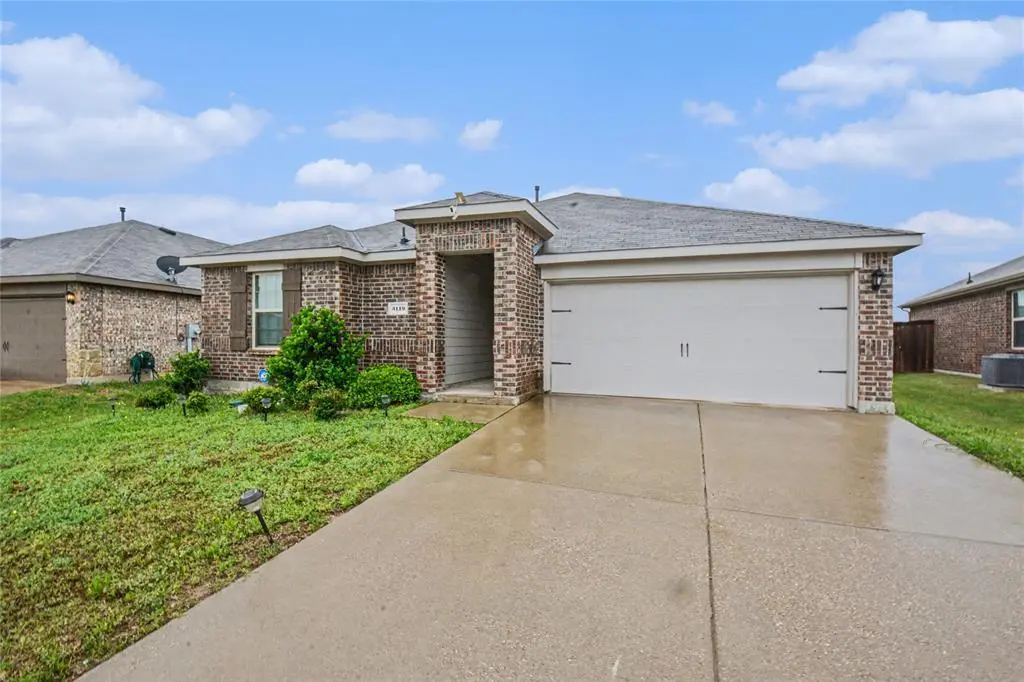
3119 Holstein Dr
Forney, TX 75126
$238,500D
3 bd · 2.0 ba ·
1,286 sqft ·
Built 2020
· SingleFamily
· Active
· 52 DOM
Cashflow @ list (25.0% down · 7.5%)
Estimated rent
$2,144/mo
Mortgage (P&I)
−$1,251
Tax + insurance
−$668
HOA
−$46
Vac / Maint / Mgmt
−$450
Net cashflow
$-271/mo
Annual
$-3,249/yr
Cap rate
4.93%
Cash-on-cash
-4.87%
DSCR
0.78
1% rule
0.90%
Cash to close
$66,780
Investor read
- This is a 3-bed/2.0-bath single-family listed at $238k.
- At list price, monthly cash flow is $-271 ($-3k/yr) — negative.
- To cash-flow at today's rent, offer at most $191k (20.1% below list).
- To meet the 1% rule (rent ≥ 1% of price), the offer needs to be $214k (10.1% below list).
- It's been on market 52 days — a 3% lower offer ($231k) is reasonable based on typical stale-listing flexibility.
- Recommended offer: $191k (20.1% below list) — sets the bar for cash-flow.
- Local home prices are declining (-3.0%/yr); year-one equity from $2k of loan paydown is wiped out by about $7k of value loss. Plan a longer hold.
- Location reads 76/100 on livability (#98 in TX, #3,339 nationally) — a middle-class / working-renter tenant base. Strengths: crime A+, employment A+, cost of living A+; Watch: amenities C-, commute F.
- Forney ISD (rural): math 41% / reading 44% proficiency, ranked #234 of 826 in TX (top 28%) — families likely to look elsewhere, expect single-tenant / working-renter base with shorter leases.
- Zoned schools: Smith Int (math 31% / reading 33%, grade F, #971 of 1,662 statewide, top 60%, 602 students, 58% FRL); Brown Middle (math 29% / reading 39%, grade F, #892 of 1,662 statewide, top 55%, 673 students, 56% FRL); North Forney H S (math 32% / reading 45%, grade F, #866 of 1,632 statewide, top 54%, 2,502 students, 49% FRL) — zoned schools average 54% FRL vs 26% district-wide (28 pts higher); higher-poverty schools than district average — tighter screening recommended.
- Watch-outs: property tax is 2.9% of price.
- Market conditions: Rents rising (+1.4%/yr); 2200 active listings in the ZIP; 40 comparable units currently listed for rent nearby; rentals at typical pace (median 26d on market — plan ~3-4 weeks tenant-placement turnaround); solid renter incomes; 1,747 units permitted in Kaufman County in 2024 (180 in 5+ unit buildings).
- Kaufman County population projected at +43% by 2050 — long-run rental-demand tailwind backs the buy-and-hold thesis.
- Climate carrying-cost: major wind risk, 27% chance of damaging wind over 30y; moderate wildfire risk; extreme-heat days projected 7→24/yr by 2055 (HVAC capex compounding) — expect insurance premiums to compound above CPI over the hold.
Questions for listing agent
- What do current leases actually rent for vs. the listed asking? Can we see a recent rent roll and the last 12 months of T-12 income?
- It's been on market 52 days. Have you received any prior offers? Is the seller open to a 20% concession, seller financing, or rate buy-down credit?
- Property tax is high relative to price — has the assessment been appealed recently, and will the sale trigger a re-assessment?
- What does the HOA fee cover, when was the last increase, and are there any pending special assessments or reserve-fund shortfalls?
- Is there a deadline driving the sale (1031 exchange, divorce, estate, relocation)? That informs how much negotiation room exists.
- Schools are B-rated — typically a magnet for longer-tenancy family renters. What's the average tenant stay here, and is there a school-zone premium baked into asking?
- The area grade is low — what's the realistic commute time and amenity access for the typical tenant pool here? Any planned neighborhood developments (good or bad) we should know about?
- What's the average days-on-market for RENTAL listings here right now (not sales)? A rising rental-DOM trend means longer vacancies and softer asking-rent achievability than the comps imply.
CashFlowRE · CFR-XSQQHYE6WBWNWB
· Data 1 day ago
cashflowre.app · 2026-05-29