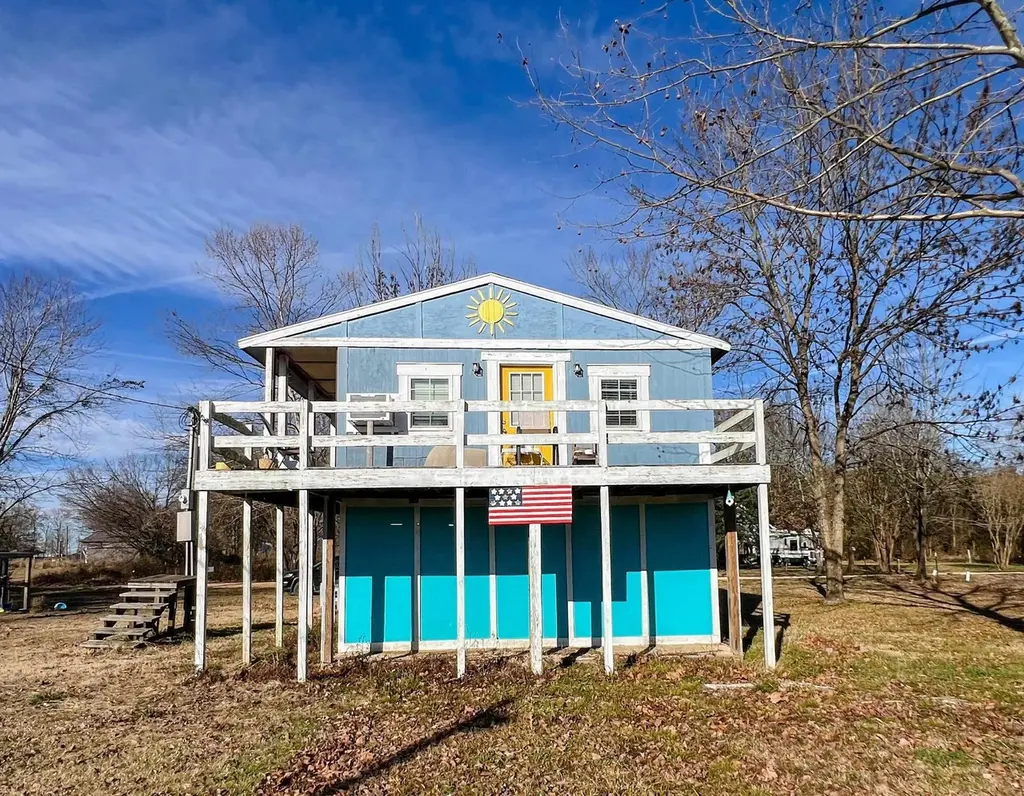
486 Water View Loop
Nixon, TN 38372
$64,000B
1 bd · 1.0 ba ·
400 sqft ·
Built 2012
· SingleFamily
· Active
· 181 DOM
Cashflow @ list (25.0% down · 7.5%)
Estimated rent
$796/mo
Mortgage (P&I)
−$336
Tax + insurance
−$473
HOA
−$0
Vac / Maint / Mgmt
−$167
Net cashflow
$-180/mo
Annual
$-2,164/yr
Cap rate
10.91%
Cash-on-cash
16.49%
DSCR
1.73
1% rule
1.24%
Cash to close
$17,920
Investor read
- This is a 1-bed/1.0-bath single-family listed at $64k.
- At list price, monthly cash flow is $-180 ($-2k/yr) — negative.
- To cash-flow at today's rent, offer at most $32k (49.8% below list).
- Meets the 1% rule at list price ($796 rent vs $64k).
- It's been on market 181 days — a 12% lower offer ($56k) is reasonable based on typical stale-listing flexibility.
- Recommended offer: $32k (49.8% below list) — sets the bar for cash-flow.
- In year one you build about $7k of equity ($442 loan paydown + $6k appreciation (10.0% local appreciation)).
- Location reads: area grade B — affects rentability + tenant quality, not the cash-flow math above.
- Hardin County (rural): math 27% / reading 28% proficiency, ranked #76 of 139 in TN (top 55%) — low school quality limits family demand, transient renter base, plan for 1-2y turnover.
- Zoned schools: East Hardin Elementary (math 22% / reading 22%, grade F, #601 of 952 statewide, top 66%, 400 students, 0% FRL); Hardin County Middle School (math 28% / reading 25%, grade F, #135 of 333 statewide, top 43%, 677 students, 0% FRL); Hardin County High School (math 23% / reading 34%, grade F, #96 of 332 statewide, top 30%, 996 students, 0% FRL) — zoned schools average 0% FRL vs 59% district-wide (59 pts lower); this property's tenant base skews higher-income than the district average.
- Watch-outs: flood insurance adds $427/mo.
- Market conditions: 390 active listings in the ZIP; 24 units permitted in Hardin County in 2024 (0 in 5+ unit buildings).
- Hardin County population projected at -17% by 2050 — secular population decline; favor cash flow + early exit over multi-decade hold.
- 2 sale attempts; this cycle's ask has dropped $5k (7%) from the opening price — seller is motivated, your offer sets the floor, not the list.
- Current owner paid $42k; list at $64k implies a 51% gain — meaningful room to come down on a strong offer.
- By year 5, paydown + projected appreciation supports a ~$32k cash-out refi (75% LTV) — recoverable capital for the next deal without selling this one.
- Climate carrying-cost: in FEMA flood zone AE (mandatory federal flood insurance); moderate wind risk, 26% chance of damaging wind over 30y; extreme-heat days projected 7→20/yr by 2055 (HVAC capex compounding) — expect insurance premiums to compound above CPI over the hold.
Questions for listing agent
- What do current leases actually rent for vs. the listed asking? Can we see a recent rent roll and the last 12 months of T-12 income?
- It's been on market 181 days. Have you received any prior offers? Is the seller open to a 50% concession, seller financing, or rate buy-down credit?
- What's the actual annual flood-insurance premium (NFIP or private), and is the property in a SFHA with mandatory coverage?
- Why hasn't it sold? Are there any deal-killer items the seller is aware of (foundation, flood, title, zoning, code violations)?
- Is there a deadline driving the sale (1031 exchange, divorce, estate, relocation)? That informs how much negotiation room exists.
- What's the average days-on-market for RENTAL listings here right now (not sales)? A rising rental-DOM trend means longer vacancies and softer asking-rent achievability than the comps imply.
- What's the recent tenant-quality profile in this submarket — average credit score on applications, eviction rate, late-payment / NSF rate, and stable-employment percentage? A property-management company in the area should have these aggregated.
- How much new for-sale + rental construction is in the pipeline within 1–3 miles? Heavy new supply typically softens prices + rents 12–24 months out; constrained supply supports both.
CashFlowRE · CFR-XX12KQ4VHCQE5K
· Data 10 h ago
cashflowre.app · 2026-05-29