486 Water View Loop · Nixon, TN
Flood risk 9/10 · Severe
- FEMA flood zone
- AE
- Chance of flooding over 30 yrs
- 0.99%
- Est. flood insurance / yr
- $1,737 – $8,500
Fire risk 3/10 · Minor
- Est. fire insurance / yr
- $949 – $1,763
Heat risk 6/10 · Moderate
- Hot days now (above 109°F)
- 7 days/yr
- Hot days in 30 yrs
- 20 days/yr
Wind risk 5/10 · Moderate
- Chance of severe wind over 30 yrs
- 26.0%
Air-quality risk 1/10 · Minimal
- Unhealthy air days now
- 0 days/yr
- Unhealthy air days in 30 yrs
- 0 days/yr
Risk factors via First Street. Map © Google.
Why this score? — see what drove the B grade
The composite is a weighted blend of 9 inputs, each scored 0–100. Each bar is that input's sub-score; the figure is the points it added to the 100-point composite (weight × sub-score).
- Cash flow +30.0/30.0
- DSCR +10.0/10.0
- Appreciation +10.0/10.0
- ARV discount +7.5/15.0
- 1% rule +7.4/10.0
- Rent growth +2.5/5.0
- Livability +2.5/5.0
- Condition / age +2.5/5.0
- Schools +2.3/10.0
$64,000
🖨 Deal sheet (PDF) 📄 Offer letter ✓ Due diligence
Listing remarks MLS
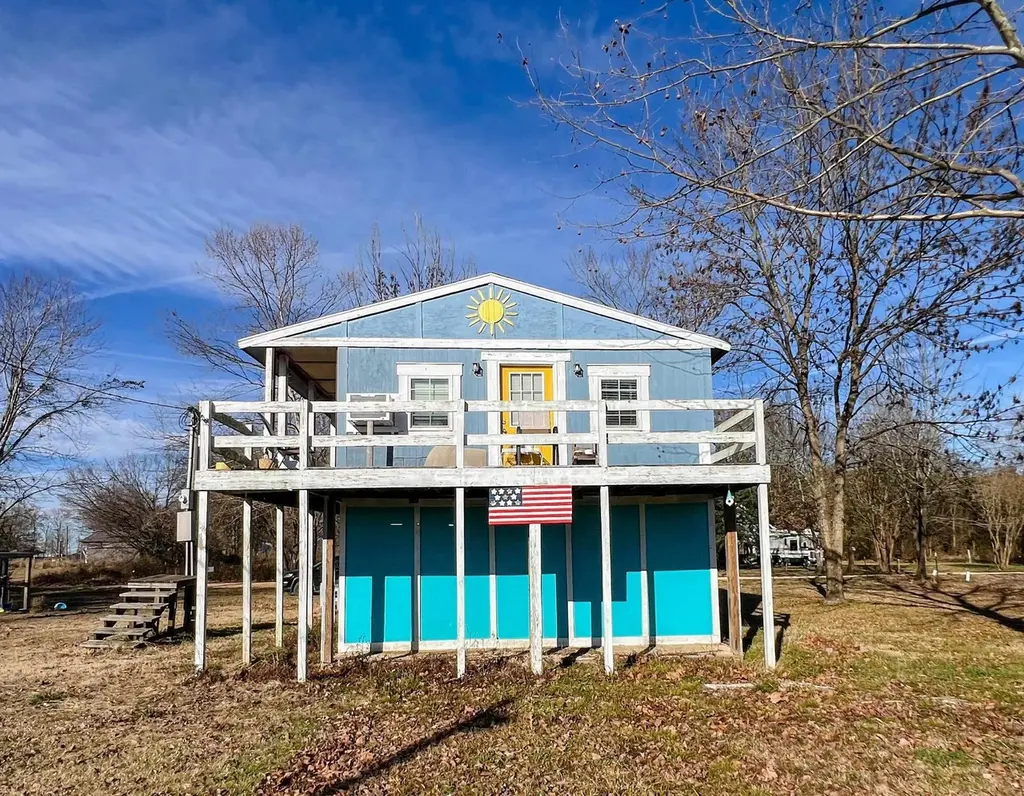
Charming 1-bed, 1-bath home featuring a wrap-around wood deck, perfect for relaxing and enjoying the outdoors by the water. The upper living area offers approximately 400 SF and features hardwood flooring with a cozy, inviting layout. The under-home level provides approximately 480 SF of convenient storage space and includes washer and dryer hookups. This property includes the home on one lot plus an additional front lot, totaling 0.62 acres and providing extra space and privacy. Together, these road-to-road parcels offer versatile use and excellent access. Ideal as a cute weekend retreat or full-time residence near the water!
Key facts
- Excellent access
- Built 2012
- Listed 181 days
Tags
Neighborhood map
What this means for you Summary
Snapshot
- This is a 1-bed/1.0-bath single-family listed at $64k.
Deal economics
- At list price, monthly cash flow is $-180 ($-2k/yr) — negative.
- To cash-flow at today's rent, offer at most $32k (49.8% below list).
- Meets the 1% rule at list price ($796 rent vs $64k).
- Recommended offer: $32k (49.8% below list) — sets the bar for cash-flow.
Location & tenants
- Location reads: area grade B — affects rentability + tenant quality, not the cash-flow math above.
- Hardin County (rural): math 27% / reading 28% proficiency, ranked #76 of 139 in TN (top 55%) — low school quality limits family demand, transient renter base, plan for 1-2y turnover.
- Zoned schools: East Hardin Elementary (math 22% / reading 22%, grade F, #601 of 952 statewide, top 66%, 400 students, 0% FRL); Hardin County Middle School (math 28% / reading 25%, grade F, #135 of 333 statewide, top 43%, 677 students, 0% FRL); Hardin County High School (math 23% / reading 34%, grade F, #96 of 332 statewide, top 30%, 996 students, 0% FRL) — zoned schools average 0% FRL vs 59% district-wide (59 pts lower); this property's tenant base skews higher-income than the district average.
- Market conditions: 390 active listings in the ZIP; 24 units permitted in Hardin County in 2024 (0 in 5+ unit buildings).
Forward outlook
- In year one you build about $7k of equity ($442 loan paydown + $6k appreciation (10.0% local appreciation)).
- Hardin County population projected at -17% by 2050 — secular population decline; favor cash flow + early exit over multi-decade hold.
- By year 5, paydown + projected appreciation supports a ~$32k cash-out refi (75% LTV) — recoverable capital for the next deal without selling this one.
Negotiation context
- It's been on market 181 days — a 12% lower offer ($56k) is reasonable based on typical stale-listing flexibility.
- 2 sale attempts; this cycle's ask has dropped $5k (7%) from the opening price — seller is motivated, your offer sets the floor, not the list.
- Current owner paid $42k; list at $64k implies a 51% gain — meaningful room to come down on a strong offer.
Risks & watch-outs
- Watch-outs: flood insurance adds $427/mo.
- Climate carrying-cost: in FEMA flood zone AE (mandatory federal flood insurance); moderate wind risk, 26% chance of damaging wind over 30y; extreme-heat days projected 7→20/yr by 2055 (HVAC capex compounding) — expect insurance premiums to compound above CPI over the hold.
Questions for the listing agent
- What do current leases actually rent for vs. the listed asking? Can we see a recent rent roll and the last 12 months of T-12 income?
- It's been on market 181 days. Have you received any prior offers? Is the seller open to a 50% concession, seller financing, or rate buy-down credit?
- What's the actual annual flood-insurance premium (NFIP or private), and is the property in a SFHA with mandatory coverage?
- Why hasn't it sold? Are there any deal-killer items the seller is aware of (foundation, flood, title, zoning, code violations)?
- Is there a deadline driving the sale (1031 exchange, divorce, estate, relocation)? That informs how much negotiation room exists.
- What's the average days-on-market for RENTAL listings here right now (not sales)? A rising rental-DOM trend means longer vacancies and softer asking-rent achievability than the comps imply.
- What's the recent tenant-quality profile in this submarket — average credit score on applications, eviction rate, late-payment / NSF rate, and stable-employment percentage? A property-management company in the area should have these aggregated.
- How much new for-sale + rental construction is in the pipeline within 1–3 miles? Heavy new supply typically softens prices + rents 12–24 months out; constrained supply supports both.
Investment metrics
- 1% rule
- 1.24% ✓
- Cap rate
- 10.91%
- Cash-on-cash
- 16.49%
- DSCR
- 1.73
- GRM
- 6.7
CMA / ARV
No comps found within radius.
Projected returns pro-forma
10.0% appreciation · 3.0% rent growth · sell at horizon
- IRR
- 16.0%
- Equity multiple
- 2.32×
- Total profit
- $23,611
- Equity at exit
- $57,656
- IRR
- 15.5%
- Equity multiple
- 5.41×
- Total profit
- $79,031
- Equity at exit
- $124,338
Cash invested: $17,920 (down + closing). Projections, not guarantees.
Landlord ↔ Tenant lean methodology
- Overall (STATE)
- 87 Strongly Landlord-Friendly
- State Tennessee
- 87 Strongly Landlord-Friendly · R+13
- County
- — inherits STATE
- City
- — inherits STATE
ZIP-level market 38372
- Home prices YoY
- 5.5%
- Active inventory
- 390
- Price-to-rent
- 6.7×
Monthly cashflow live
- Estimated rent
- $796 medium interval (Pro) →
- Mortgage (P&I)
- −$336
- Tax from tax record
- −$20 /mo · $242/yr
- Insurance
- −$27
- Flood insurance flood zone
- −$427 /mo · $5,118/yr
- HOA
- −$0
- Vacancy / Maint / Mgmt
- −$167
- Net cashflow
- $-180
Break-even live
Sensitivity live
| Price | -10% $-144 | -5% $-162 | +0% $-180 | +5% $-198 | +10% $-217 |
|---|---|---|---|---|---|
| Rent | -10% $-243 | -5% $-212 | +0% $-180 | +5% $-149 | +10% $-117 |
| Rate | -1.0pp $-148 | -0.5pp $-164 | base $-180 | +0.5pp $-197 | +1.0pp $-214 |
UW: 25.0% down · 7.5% · 30yr · 1.5% tax · 5.0% vac · 8.0% maint · 8.0% mgmt
Financing live
Cash to close
- Down payment
- $16,000
- Closing costs
- $1,920
- Reserves months
- —
- Total cash needed
- —
Loan-product check · same deal, 3 products live
Conventional
25% down · 7.5% · 30yr
- Down + closing
- —
- Monthly P&I
- —
- Monthly cashflow
- —
- DSCR
- —
- Eligible?
- —
Personal DTI + credit; lowest rate.
DSCR
20% down · 8.5% · 30yr
- Down + closing
- —
- Monthly P&I
- —
- Monthly cashflow
- —
- DSCR
- —
- Eligible?
- —
No personal income docs; deal must DSCR.
Hard money
10% down · 12.0% · 12mo
- Down + closing
- —
- Monthly P&I
- —
- Monthly cashflow
- —
- DSCR
- —
- Eligible?
- —
Short-term bridge; refi at stabilization.
Listing history 23 events
-
2026-06-21days on market $64,000 Active 181 DOM
-
2026-06-21days on market $64,000 Active 180 DOM
-
2026-06-18days on market $64,000 Active 178 DOM
-
2026-06-17days on market $64,000 Active 177 DOM
-
2026-06-16days on market $64,000 Active 176 DOM
-
2026-06-15days on market $64,000 Active 175 DOM
-
2026-06-13days on market $64,000 Active 173 DOM
-
2026-06-12days on market $64,000 Active 172 DOM
-
2026-06-09days on market $64,000 Active 169 DOM
-
2026-06-08days on market $64,000 Active 168 DOM
-
2026-06-08days on market $64,000 Active 167 DOM
-
2026-06-07days on market $64,000 Active 166 DOM
-
2026-06-03days on market $64,000 Active 163 DOM
-
2026-06-02days on market $64,000 Active 162 DOM
-
2026-06-01days on market $64,000 Active 161 DOM
-
2026-05-31days on market $64,000 Active 160 DOM
-
2026-04-11price $64,000 634-char remark
Show marketing remark (634 chars)
Charming 1-bed, 1-bath home featuring a wrap-around wood deck, perfect for relaxing and enjoying the outdoors by the water. The upper living area offers approximately 400 SF and features hardwood flooring with a cozy, inviting layout. The under-home level provides approximately 480 SF of convenient storage space and includes washer and dryer hookups. This property includes the home on one lot plus an additional front lot, totaling 0.62 acres and providing extra space and privacy. Together, these road-to-road parcels offer versatile use and excellent access. Ideal as a cute weekend retreat or full-time residence near the water!
-
2026-04-10price $64,000 634-char remark
Show marketing remark (634 chars)
Charming 1-bed, 1-bath home featuring a wrap-around wood deck, perfect for relaxing and enjoying the outdoors by the water. The upper living area offers approximately 400 SF and features hardwood flooring with a cozy, inviting layout. The under-home level provides approximately 480 SF of convenient storage space and includes washer and dryer hookups. This property includes the home on one lot plus an additional front lot, totaling 0.62 acres and providing extra space and privacy. Together, these road-to-road parcels offer versatile use and excellent access. Ideal as a cute weekend retreat or full-time residence near the water!
-
2025-12-22$69,000 Active 634-char remark
Show marketing remark (634 chars)
Charming 1-bed, 1-bath home featuring a wrap-around wood deck, perfect for relaxing and enjoying the outdoors by the water. The upper living area offers approximately 400 SF and features hardwood flooring with a cozy, inviting layout. The under-home level provides approximately 480 SF of convenient storage space and includes washer and dryer hookups. This property includes the home on one lot plus an additional front lot, totaling 0.62 acres and providing extra space and privacy. Together, these road-to-road parcels offer versatile use and excellent access. Ideal as a cute weekend retreat or full-time residence near the water!
-
2022-03-24soldstatus $42,500
-
2006-02-08soldstatus $4,800
-
2000-04-28soldstatus $1,500
ⓘ Source: listings_history table (triggers on properties + properties_extension) + one-shot
backfill from property_details.listing_events for pre-trigger history.
Tax reassessment forecast TN · Resets to sale price
- Current annual tax
- $242 · $20/mo
- Projected year-2 tax
- $454 · $38/mo
- Expected delta
- +$212/yr (+$18/mo · 87.8%)
ⓘ Screening estimate from a state-policy table — verify with the county assessor before closing.
Climate risk First Street
- Flood 9/10 Extreme FEMA zone AE · 99% chance over 30 yrs
- Wildfire 3/10 Moderate
- Heat 6/10 Major 7 d/yr ≥109°F today · 20 d/yr by 30 yrs out
- Wind 5/10 Major 26% chance of damaging wind over 30 yrs
- Air quality 1/10 Low 0 unhealthy d/yr today · 0 by 30 yrs out
Nearby sold comps map
Loading sold comps map…
Walkable amenities ~0.75 mi
Loading nearby amenities…
Taxation est. · year 1
- Rental income
- $9,550
- − Mortgage interest
- −$3,585
- − Property taxes
- −$242
- − Insurance
- −$5,438
- − Repairs & maintenance
- −$764
- − Management
- −$764
- − Depreciation
- −$1,862
- Taxable loss
- −$3,105
- Est. tax savings @ 24.0%
- +$745
- After-tax cash flow
- $-1,418/yr
For passive investors: Depreciation is non-cash, so a rental often shows a tax loss while cash-flowing — sheltering income. Rental losses are passive: they offset passive income freely, and up to $25,000/yr can offset ordinary (W-2) income if you actively participate and your MAGI is under $100k (phasing out to $0 by $150k); unused losses carry forward. On sale, claimed depreciation is recaptured at up to 25%, and gains may owe capital-gains tax (a 1031 exchange can defer both). Figures are a year-1 estimate at your 24.0% rate — not tax advice; consult a CPA.
Schools (NCES district)
- District
- Hardin County
- NCES district ID
- 4701680
- Math proficiency
- 27% ▼ -1.00%
- Reading proficiency
- 28% ▼ -1.00%
- Median HH income
- $34,404
- Composite
- 22.64/100
- National rank
- #8061
- State rank
- #76 of 139 in TN
Livability — Nixon
No livability data for this city. (Only ~50 U.S. cities are tracked.)
Census & demographics
- Population (ZIP)
- 17,659
Population outlook (Hardin County) Hauer SSP2
- Today (2025)
- 24,740 people
- By 2030
- 23,971 · -3.1%
- By 2040
- 22,284 · -9.9%
- By 2050
- 20,612 · -16.7%
- By 2075
- 17,072 · -31.0%
- By 2100
- 13,723 · -44.5%
Race, ethnicity, and origin ACS 2023
- Neighborhood character
- Predominantly White (89%)
- Race & ethnicity
- White 89% Two or more races 5% Black 3% Hispanic / Latino 3%
- Common ancestry
- Italian 5% Slovak 2% Danish 2%
- Foreign-born
- 1% · Canada
- Languages at home
- 97% English-only · Spanish 2% German/W. Germanic 1%
Political lean MEDSL · Hardin
- 2024 margin
- Solid R (+71.0) · D 14.1% · R 85.1%
- 2008→2024 swing
- -28.3pp toward R · 2008: -42.7pp · 2024: -71.0pp
- All cycles
- 2024: R+71.0 2020: R+67.5 2016: R+64.2 2012: R+51.6 2008: R+42.7
Not yet ingested
- Civics
- —
Market trends
- HPI YoY
- ▲ 15.20%
- Current HPI
- 293.51
- Rent YoY
- —
- Metro
- —
- State GDP YoY
- ▲ 2.78%
- F500 in state
- 22
Industry mix (Fortune 500 HQ in TN)
| Industry | F500 HQs | Revenue |
|---|---|---|
| Healthcare | 3 | $91B |
|
||
| Retail | 3 | $72B |
|
||
| Transportation / Logistics | 1 | $88B |
|
||
| Paper / Packaging | 1 | $19B |
|
||
| Insurance | 1 | $13B |
|
||
| Energy | 1 | $12B |
|
||
Price history
+4166.7% since first listed7 events — show timeline
- 2026-04-11 Price Changed $64,000 Memphis Area Association of Realtors(R) MLS
- 2026-04-10 Price Changed $64,000 REALTRACS as Distributed by MLS Grid
- 2025-12-22 Listed $69,000 REALTRACS as Distributed by MLS Grid
- 2025-12-22 Listed $69,000 Memphis Area Association of Realtors(R) MLS
- 2022-03-24 Sold (Public Records) $42,500 Public Records
- 2006-02-08 Sold (Public Records) $4,800 Public Records
- 2000-04-28 Sold (Public Records) $1,500 Public Records
Property tax history
+4.4%/yrLatest (2025): $242 · +0.0% YoY. Source: county tax records.
Cash-flow waterfall
monthlySold comps — $/sqft
last 12 mo · ≤1 miLoading sold comps…