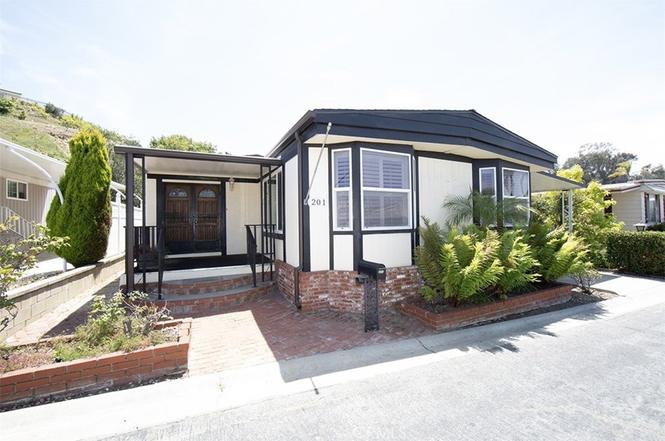
2550 Pacific Coast Hwy #201
Torrance, CA 90505
$289,000C-
2 bd · 2.0 ba ·
1,654 sqft ·
Built 1971
· Manufactured
· Active
· 7 DOM
Cashflow @ list (25.0% down · 7.5%)
Estimated rent
$2,747/mo
Mortgage (P&I)
−$1,516
Tax + insurance
−$482
HOA
−$0
Vac / Maint / Mgmt
−$577
Net cashflow
$173/mo
Annual
$2,074/yr
Cap rate
7.01%
Cash-on-cash
2.56%
DSCR
1.11
1% rule
0.95%
Cash to close
$80,920
Investor read
- This is a 2-bed/2.0-bath manufactured listed at $289k.
- At list price, monthly cash flow is $173 ($2k/yr) — positive.
- The deal already cash-flows at list — no discount required.
- To meet the 1% rule (rent ≥ 1% of price), the offer needs to be $275k (5.0% below list).
- Only 7 days on market — expect competitive offers; lowballing is unlikely to land.
- Recommended offer: $275k (5.0% below list) — sets the bar for 1% rule.
- Local home prices are declining (-3.0%/yr); year-one equity from $2k of loan paydown is wiped out by about $9k of value loss. Plan a longer hold.
- Location reads 76/100 on livability (#95 in CA, #3,501 nationally) — a middle-class / working-renter tenant base. Strengths: amenities A+, commute A+, employment A+; Watch: health & safety C-, crime D+, cost of living F.
- Los Angeles Unified (urban): math 29% / reading 54% proficiency, ranked #223 of 517 in CA (top 43%) — families likely to look elsewhere, expect single-tenant / working-renter base with shorter leases; 67% free/reduced lunch — lower-income household profile, screen leases tightly.
- Zoned schools: Eshelman Avenue Elementary (453 students, 87% FRL); Alexander Fleming Middle (1,085 students, 87% FRL); Nathaniel Narbonne Senior High (math 28% / reading 56%, grade F, #472 of 1,170 statewide, top 42%, 1,731 students, 84% FRL) — zoned schools average 86% FRL vs 67% district-wide (19 pts higher); higher-poverty schools than district average — tighter screening recommended.
- Market conditions: Rents rising fast (+4.5%/yr); 62 active listings in the ZIP; 28 comparable units currently listed for rent nearby; rentals at typical pace (median 23d on market — plan ~3-4 weeks tenant-placement turnaround); high-income renter base; 19,697 units permitted in Los Angeles County in 2024 (9,426 in 5+ unit buildings).
- Los Angeles County population projected at +9% by 2050 — modest demand growth; plan on rents tracking national, not racing it.
- 5 sale attempts since 16y ago with the ask held roughly flat each time — persistent listings suggest the price (not the market) is what's stuck; bring a comps-based counter.
- Cap rate 7.0% vs local median 2.1% in Torrance — top-decile yield for the area; either an underpriced asset or a hidden risk that comps aren't pricing in. Stress-test before assuming the spread holds.
Questions for listing agent
- Built in 1971 — when were the roof, HVAC, electrical panel, plumbing, and water heater last replaced?
- Is there a deadline driving the sale (1031 exchange, divorce, estate, relocation)? That informs how much negotiation room exists.
- Schools are A-rated — typically a magnet for longer-tenancy family renters. What's the average tenant stay here, and is there a school-zone premium baked into asking?
- Crime grade is D in this area — have there been break-ins, vandalism, or insurance claims at this property in the last 3 years? What carrier currently insures it and at what premium?
- What's the average days-on-market for RENTAL listings here right now (not sales)? A rising rental-DOM trend means longer vacancies and softer asking-rent achievability than the comps imply.
- What's the recent tenant-quality profile in this submarket — average credit score on applications, eviction rate, late-payment / NSF rate, and stable-employment percentage? A property-management company in the area should have these aggregated.
- How much new for-sale + rental construction is in the pipeline within 1–3 miles? Heavy new supply typically softens prices + rents 12–24 months out; constrained supply supports both.
CashFlowRE · CFR-XXNVZ3BPQVFYQD
· Data 1 h ago
cashflowre.app · 2026-05-29