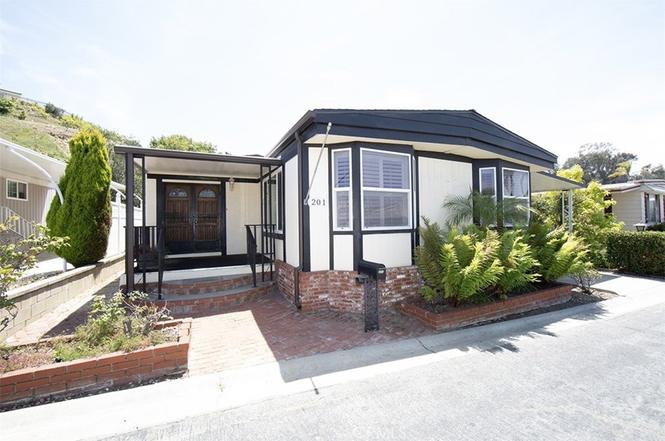
2550 Pacific Coast Hwy #201 · Torrance, CA
Flood risk 1/10 · Minimal
- FEMA flood zone
- X (unshaded)
- Chance of flooding over 30 yrs
- 0.0%
- Est. flood insurance / yr
- $507 – $1,088
Fire risk 2/10 · Minimal
- Est. fire insurance / yr
- $659 – $1,223
Heat risk 3/10 · Minor
- Hot days now (above 86°F)
- 7 days/yr
- Hot days in 30 yrs
- 22 days/yr
Wind risk 1/10 · Minimal
- Chance of severe wind over 30 yrs
- —
Air-quality risk 5/10 · Moderate
- Unhealthy air days now
- 7 days/yr
- Unhealthy air days in 30 yrs
- 7 days/yr
Risk factors via First Street. Map © Google.
Why this score? — see what drove the B- grade
The composite is a weighted blend of 9 inputs, each scored 0–100. Each bar is that input's sub-score; the figure is the points it added to the 100-point composite (weight × sub-score).
- Cash flow +27.1/30.0
- ARV discount +11.3/15.0
- DSCR +9.4/10.0
- 1% rule +7.3/10.0
- Livability +3.8/5.0
- Rent growth +3.6/5.0
- Schools +3.6/10.0
- Condition / age +2.5/5.0
- Appreciation +0.0/10.0
$289,000
🖨 Deal sheet (PDF) 📄 Offer letter ✓ Due diligence
Listing remarks MLS
Beautiful and large 2 bedroom 2 bath home located in desirable Skyline Mobile Home Park, a 55 plus senior community, This renovated home offers upgrades including double door entry, recessed lighting, fireplace. Kitchen has granite counter tops, stainless steel refrigerator, double oven & dishwasher. Extra large master bath with jacuizzi tub. Home is located at top of the hill on large lot with privacy. Enjoy the covered deck off of the living room. Lush landscaping and plenty of room for gardening. Open Floor plan. Skyline is an active senior community with many amenities such as a recreation center with pool, jacuizzi, billiard room, card room and activities. Great location right across the street from Rolling Hills Plaza, where you can enjoy the many restaurants and shops such as Trader Joes, Whole Foods, AMC Theater and Islands Restaurant.
Key facts
- Recessed lighting
- Granite counter tops
- Double door entry
Tags
Property features AI
Finance
- Other: Manager approval required for residency; Pets: contact manager
- Financial info: Monthly land lease: $2,647 (park provided); Rent includes water and sewer
- HOA & community: Land lease community (park); Park name: Skyline MHP; Community features include street lighting
Exterior
- Parking: Attached carport with 3 parking spaces; Paved parking
- Security: Gated community with attendant; Smoke detectors; Carbon monoxide detectors; Resident manager
- Utilities: Standard electric; Natural gas connected; Public water (district); Public sewer
- Home design: Single-story manufactured home (GoldenWest model); Mobile home remains; Turnkey condition; Facing/view available
- Construction: Masonite exterior/skirt; Pillar/post/pier foundation; Year built per public records
- Exterior features: Covered deck/patio; Rain gutters; Community pool; Landscaped grounds; One shed (on property); Average-condition fencing
Interior
- Kitchen: Gas cooktop; Double oven; Dishwasher; Garbage disposal; Refrigerator; Granite countertops; Gas water heater
- Bedrooms: All bedrooms on main level
- Flooring: Wood flooring; Laminate flooring
- Bathrooms: One full bath; One 3/4 bath; Master bath with double sinks; Shower and bathtub; Shower in tub
- Heating & cooling: Central heating (furnace); Central cooling
- Interior features: Ceiling fan; Recessed lighting; Granite counters; Blinds; One-level entry (entry at front door); Community spa
- Laundry & utility: Dedicated laundry room; Washer included; Dryer included
Neighborhood map
What this means for you Summary
Snapshot
- This is a 2-bed/2.0-bath manufactured listed at $289k.
Deal economics
- At list price, monthly cash flow is $821 ($10k/yr) — positive.
- The deal already cash-flows at list — no discount required.
- Meets the 1% rule at list price ($4k rent vs $289k).
- Cap rate 9.7% vs local median 2.1% in Torrance — top-decile yield for the area; either an underpriced asset or a hidden risk that comps aren't pricing in. Stress-test before assuming the spread holds.
Location & tenants
- Location reads 76/100 on livability (#95 in CA, #3,501 nationally) — a middle-class / working-renter tenant base. Strengths: amenities A+, commute A+, employment A+; Watch: health & safety C-, crime D+, cost of living F.
- Los Angeles Unified (urban): math 29% / reading 54% proficiency, ranked #223 of 517 in CA (top 43%) — families likely to look elsewhere, expect single-tenant / working-renter base with shorter leases; 67% free/reduced lunch — lower-income household profile, screen leases tightly.
- Zoned schools: Eshelman Avenue Elementary (453 students, 87% FRL); Alexander Fleming Middle (1,085 students, 87% FRL); Nathaniel Narbonne Senior High (math 28% / reading 56%, grade F, #472 of 1,170 statewide, top 42%, 1,731 students, 84% FRL) — zoned schools average 86% FRL vs 67% district-wide (19 pts higher); higher-poverty schools than district average — tighter screening recommended.
- Market conditions: Rents rising fast (+4.5%/yr); 61 active listings in the ZIP; 28 comparable units currently listed for rent nearby; rentals at typical pace (median 23d on market — plan ~3-4 weeks tenant-placement turnaround); high-income renter base; 19,697 units permitted in Los Angeles County in 2024 (9,426 in 5+ unit buildings).
- This rent runs 37% of the median local income ($116k/yr) — at the standard rent-burdened threshold; future hikes will face affordability resistance.
Forward outlook
- Local home prices are declining (-3.0%/yr); year-one equity from $2k of loan paydown is wiped out by about $9k of value loss. Plan a longer hold.
- Los Angeles County population projected at +9% by 2050 — modest demand growth; plan on rents tracking national, not racing it.
- At projected returns (-3.0% appreciation + 4.5% rent growth), your $81k cash investment doubles in ~9 years — after that, you're playing with house money.
Negotiation context
- Only 6 days on market — expect competitive offers; lowballing is unlikely to land.
- 5 sale attempts since 16y ago with the ask held roughly flat each time — persistent listings suggest the price (not the market) is what's stuck; bring a comps-based counter.
Questions for the listing agent
- Built in 1971 — when were the roof, HVAC, electrical panel, plumbing, and water heater last replaced?
- Is there a deadline driving the sale (1031 exchange, divorce, estate, relocation)? That informs how much negotiation room exists.
- Schools are A-rated — typically a magnet for longer-tenancy family renters. What's the average tenant stay here, and is there a school-zone premium baked into asking?
- Crime grade is D in this area — have there been break-ins, vandalism, or insurance claims at this property in the last 3 years? What carrier currently insures it and at what premium?
- What's the average days-on-market for RENTAL listings here right now (not sales)? A rising rental-DOM trend means longer vacancies and softer asking-rent achievability than the comps imply.
- What's the recent tenant-quality profile in this submarket — average credit score on applications, eviction rate, late-payment / NSF rate, and stable-employment percentage? A property-management company in the area should have these aggregated.
- How much new for-sale + rental construction is in the pipeline within 1–3 miles? Heavy new supply typically softens prices + rents 12–24 months out; constrained supply supports both.
Investment metrics
- 1% rule
- 1.23% ✓
- Cap rate
- 9.70%
- Cash-on-cash
- 12.18%
- DSCR
- 1.54
- GRM
- 6.8
CMA / ARV
- ARV (on-the-fly)
- $315,914
- Comps found
- 7
Show comp detail 7 sales within ~0.75 mi
| Address | Dist | Beds/Ba | Sqft | Sold | Price | $/sf | Match |
|---|---|---|---|---|---|---|---|
| 2550 Pacific Coast Hwy. #182 | 0.16mi | 3/2.0 (+1) | 1,692 (+2%) | 0mo | $310,000 | $183 | 84 |
| 2550 Pacific Coast #194 | 0.16mi | 3/2.0 (+1) | 1,624 (-2%) | 8mo | $310,000 | $191 | 78 |
| 2550 Pacific Coast Hwy #220 | 0.25mi | 2/2.0 | 1,640 (-1%) | 13mo | $249,000 | $152 | 76 |
| 2550 E Pacific Coast Hwy #212 | 0.13mi | 2/2.0 | 1,440 (-13%) | 6mo | $275,000 | $191 | 67 |
| 2550 Pacific Coast Hwy #230 | 0.00mi | 2/2.0 | 1,440 (-13%) | 19mo | $354,900 | $246 | 62 |
| 2550 Pacific Coast Highway, Space 181 | 0.16mi | 2/2.0 | 1,464 (-12%) | 14mo | $260,000 | $178 | 62 |
| 2550 Pacific Coast Hwy #204 | 0.16mi | 2/2.0 | 1,440 (-13%) | 23mo | $310,000 | $215 | 52 |
Match score weights: distance 35% · size 25% · config 20% · recency 20%. Top-matched comps best support the ARV.
Projected returns pro-forma
-3.0% appreciation · 4.55% rent growth · sell at horizon
- IRR
- 3.5%
- Equity multiple
- 1.14×
- Total profit
- $11,167
- Equity at exit
- $43,091
- IRR
- 14.5%
- Equity multiple
- 2.25×
- Total profit
- $101,206
- Equity at exit
- $24,987
Cash invested: $80,920 (down + closing). Projections, not guarantees.
Landlord ↔ Tenant lean methodology
- Overall (STATE)
- 18 Strongly Tenant-Friendly
- State California
- 18 Strongly Tenant-Friendly · D+13
- County
- — inherits STATE
- City
- — inherits STATE
ZIP-level market 90505
- Rents YoY
- 4.5%
- Active inventory
- 61
- Price-to-rent
- 6.8×
Monthly cashflow live
- Estimated rent
- $3,567 high interval (Pro) →
- Mortgage (P&I)
- −$1,516
- Tax est. 1.5%
- −$361 /mo · $4,335/yr
- Insurance
- −$120
- HOA
- −$0
- Vacancy / Maint / Mgmt
- −$749
- Net cashflow
- $821
Break-even live
Sensitivity live
| Price | -10% $1,021 | -5% $921 | +0% $821 | +5% $721 | +10% $621 |
|---|---|---|---|---|---|
| Rent | -10% $539 | -5% $680 | +0% $821 | +5% $962 | +10% $1,103 |
| Rate | -1.0pp $967 | -0.5pp $895 | base $821 | +0.5pp $746 | +1.0pp $670 |
UW: 25.0% down · 7.5% · 30yr · 1.5% tax · 5.0% vac · 8.0% maint · 8.0% mgmt
Financing live
Cash to close
- Down payment
- $72,250
- Closing costs
- $8,670
- Reserves months
- —
- Total cash needed
- —
Loan-product check · same deal, 3 products live
Conventional
25% down · 7.5% · 30yr
- Down + closing
- —
- Monthly P&I
- —
- Monthly cashflow
- —
- DSCR
- —
- Eligible?
- —
Personal DTI + credit; lowest rate.
DSCR
20% down · 8.5% · 30yr
- Down + closing
- —
- Monthly P&I
- —
- Monthly cashflow
- —
- DSCR
- —
- Eligible?
- —
No personal income docs; deal must DSCR.
Hard money
10% down · 12.0% · 12mo
- Down + closing
- —
- Monthly P&I
- —
- Monthly cashflow
- —
- DSCR
- —
- Eligible?
- —
Short-term bridge; refi at stabilization.
Rent comps 28 comps
| Address | Beds | Baths | Sqft | Rent | $/sqft | DOM | Units | Dist |
|---|---|---|---|---|---|---|---|---|
| 25829 Viana Ave Lomita, CA | 2.0 | 1.5 | 1160 | $3,149 | $2.71 | 5d | 2 | 0.22mi |
| 26015 Crest Rd Torrance, CA | 3.0 | 2.0 | 1214 | $4,300 | $3.54 | 19d | 1 | 0.38mi |
| 2525 Grand Summit Rd Torrance, CA | 3.0 | 2.0 | 1844 | $5,500 | $2.98 | 17d | 1 | 0.48mi |
| 2525 Grand Summit Rd Torrance, CA | 3.0 | 2.0 | 1844 | $5,500 | $2.98 | 20d | 1 | 0.48mi |
| 26110 Narbonne Ave Apt 9 Lomita, CA | 2.0 | 2.0 | 1100 | $2,399 | $2.18 | 46d | 1 | 0.50mi |
| 25930 Narbonne Ave #110 Lomita, CA | 2.0 | 2.0 | 1062 | $2,850 | $2.68 | 0d | 1 | 0.50mi |
| 26205 Oak St Lomita, CA | 3.0 | 2.0 | 1430 | $4,000 | $2.80 | 46d | 1 | 0.57mi |
| 25205 Cypress St Unit 3 Lomita, CA | 3.0 | 2.5 | 1397 | $3,395 | $2.43 | 46d | 1 | 0.66mi |
| 25930 Rolling Hills Rd Torrance, CA | 1.0–2.0 | 1.0–1.5 | 1055 | $2,950 | $2.80 | 4d | 5 | 0.69mi |
| 2403 251st St Lomita, CA | 3.0 | 2.0 | 1890 | $3,600 | $1.90 | 26d | 1 | 0.70mi |
| 25326 Oak St Unit 1 Lomita, CA | 3.0 | 2.0 | 1300 | $3,650 | $2.81 | 46d | 1 | 0.81mi |
| 25021 Oak St Lomita, CA | 3.0 | 2.0 | 1281 | $3,995 | $3.12 | 10d | 1 | 0.95mi |
| 2222 248th St Unit 2228 Lomita, CA | 3.0 | 2.0 | 1199 | $3,200 | $2.67 | 10d | 1 | 0.95mi |
| 2110 Palos Verdes Dr N #103 Lomita, CA | 2.0 | 2.0 | 1357 | $3,250 | $2.39 | 46d | 1 | 1.02mi |
| 1918 252nd St Lomita, CA | 3.0 | 2.0 | 1488 | $3,900 | $2.62 | 46d | 1 | 1.06mi |
| 25018 Eshelman Ave Lomita, CA | 2.0 | 2.5 | 1400 | $3,295 | $2.35 | 46d | 1 | 1.09mi |
| 25018 Eshelman Ave Unit 9 Lomita, CA | 2.0 | 2.5 | 1400 | $3,295 | $2.35 | 26d | 1 | 1.10mi |
| 25316 Ebony Ln Lomita, CA | 3.0 | 3.0 | 1890 | $3,415 | $1.81 | 15d | 1 | 1.10mi |
| 25316 Ebony Ln Ste 1 Lomita, CA | 3.0 | 3.0 | 1890 | $3,415 | $1.81 | 13d | 1 | 1.10mi |
| 1676 259th St Harbor City, CA | 2.0 | 1.0 | 1250 | $2,795 | $2.24 | 18d | 1 | 1.21mi |
| 25122 Ebony Ln Lomita, CA | 2.0 | 2.0 | 1716 | $2,955 | $1.72 | 23d | 1 | 1.22mi |
| 1732 251st St Lomita, CA | 3.0 | 1.0 | 1200 | $4,000 | $3.33 | 46d | 1 | 1.29mi |
| 2457 Lomita Blvd Lomita, CA | 2.0 | 1.0–2.0 | 878 | $5,036 | $5.74 | 0d | 14 | 1.32mi |
| 1623 255th St W Harbor City, CA | 3.0 | 3.0 | 1344 | $3,995 | $2.97 | 1d | 1 | 1.37mi |
| 1530 260th St Apt 6 Harbor City, CA | 3.0 | 2.0 | 1150 | $3,295 | $2.87 | 23d | 1 | 1.39mi |
| 1530 260th St Apt 6 Harbor City, CA | 3.0 | 2.0 | 1150 | $3,295 | $2.87 | 1d | 1 | 1.39mi |
| 1673 251st St Harbor City, CA | 1.0 | 1.0 | 2104 | $1,200 | $0.57 | 26d | 1 | 1.40mi |
| 2219 Estribo Dr Rolling Hills Estates, CA | 3.0 | 3.0 | 1512 | $9,495 | $6.28 | 46d | 1 | 1.41mi |
Listing history 5 events
-
2026-06-21days on market $289,000 Active 6 DOM
-
2026-06-18days on market $289,000 Active 3 DOM
-
2026-06-17days on market $289,000 Active 2 DOM
-
2026-06-16remarks 695-char remark
-
2026-06-16$289,000 Active 1 DOM
ⓘ Source: listings_history table (triggers on properties + properties_extension) + one-shot
backfill from property_details.listing_events for pre-trigger history.
Climate risk First Street
- Flood 1/10 Low FEMA zone X (unshaded) · 0% chance over 30 yrs
- Wildfire 2/10 Low
- Heat 3/10 Moderate 7 d/yr ≥86°F today · 22 d/yr by 30 yrs out
- Wind 1/10 Low
- Air quality 5/10 Major 7 unhealthy d/yr today · 7 by 30 yrs out
Nearby sold comps map
Loading sold comps map…
Walkable amenities ~0.75 mi
Loading nearby amenities…
Taxation est. · year 1
- Rental income
- $42,809
- − Mortgage interest
- −$16,188
- − Property taxes
- −$4,335
- − Insurance
- −$1,445
- − Repairs & maintenance
- −$3,425
- − Management
- −$3,425
- − Depreciation
- −$8,407
- Taxable income
- $5,584
- Est. tax owed @ 24.0%
- −$1,340
- After-tax cash flow
- $8,513/yr
For passive investors: Depreciation is non-cash, so a rental often shows a tax loss while cash-flowing — sheltering income. Rental losses are passive: they offset passive income freely, and up to $25,000/yr can offset ordinary (W-2) income if you actively participate and your MAGI is under $100k (phasing out to $0 by $150k); unused losses carry forward. On sale, claimed depreciation is recaptured at up to 25%, and gains may owe capital-gains tax (a 1031 exchange can defer both). Figures are a year-1 estimate at your 24.0% rate — not tax advice; consult a CPA.
Schools (NCES district)
- District
- Los Angeles Unified
- NCES district ID
- 0622710
- Math proficiency
- 29% ▼ -4.00%
- Reading proficiency
- 54% ▲ 10.00%
- Median HH income
- $50,403
- Composite
- 35.67/100
- National rank
- #4875
- State rank
- #223 of 517 in CA
Livability — Torrance
- Score
- 76/100
- State rank
- #95
- US rank
- #3501
Category grades
Schools grade is shown separately in the Schools card above.
Census & demographics
- Census place
- Torrance, CA
- County
- Los Angeles County · 9,444,647 people
- City population
- 153,473
- Metro
- Los Angeles-Long Beach-Anaheim, CA
- Population (ZIP)
- 35,148
- Household income
- $115,593
- Rent vs Own
- Severe rent burden
- 1527.0
Population outlook (Los Angeles County) Hauer SSP2
- Today (2025)
- 10,940,515 people
- By 2030
- 11,256,481 · +2.9%
- By 2040
- 11,729,929 · +7.2%
- By 2050
- 11,948,407 · +9.2%
- By 2075
- 11,818,114 · +8.0%
- By 2100
- 10,842,928 · -0.9%
Race, ethnicity, and origin ACS 2023
- Neighborhood character
- Diverse neighborhood (Simpson 0.69)
- Race & ethnicity
- Asian 41% White 35% Hispanic / Latino 14% Two or more races 12% Black 3%
- Hispanic origin (detail)
- Mexican 8%
- Common ancestry
- Romanian 2% Portuguese 1% Slovak 1%
- Foreign-born
- 31% · South Korea, Canada, China
- Languages at home
- 60% English-only · Other Asian/Pacific 11% Korean 8% Spanish 7%
Political lean MEDSL · Los Angeles
- 2024 margin
- Solid D (+32.9) · D 64.8% · R 31.9% · Other 3.3%
- 2008→2024 swing
- -7.4pp toward R · 2008: 40.4pp · 2024: 32.9pp
- All cycles
- 2024: D+32.9 2020: D+44.2 2016: D+48.0 2012: D+40.0 2008: D+40.4
Not yet ingested
- Civics
- —
Market trends
- HPI YoY
- ▼ -906.04%
- Current HPI
- 352.4976
- Rent YoY
- ▲ 4.55%
- Metro
- Los Angeles-Long Beach-Anaheim, CA
- State GDP YoY
- ▲ 3.21%
- F500 in state
- 116
Industry mix (Fortune 500 HQ in CA)
| Industry | F500 HQs | Revenue |
|---|---|---|
| Technology | 27 | $1,492B |
|
||
| Financial Services | 3 | $174B |
|
||
| Retail | 3 | $44B |
|
||
| Insurance | 3 | $26B |
|
||
| Media / Entertainment | 2 | $115B |
|
||
| Pharmaceuticals / Biotech | 2 | $62B |
|
||
Price history
+44.9% since first listed23 events — show timeline
- 2026-06-15 Listed $289,000 CRMLS
- 2022-08-26 Sold (MLS) $349,000 CRMLS
- 2022-08-14 Pending — CRMLS
- 2022-07-06 Contingent — CRMLS
- 2022-06-11 Price Changed $349,000 CRMLS
- 2022-05-22 Relisted — CRMLS
- 2022-04-19 Contingent — CRMLS
- 2022-03-16 Listed $360,000 CRMLS
- 2018-05-16 Sold (MLS) $225,000 CRMLS
- 2018-04-30 Pending — CRMLS
- 2018-02-23 Price Changed $249,500 CRMLS
- 2018-01-16 Price Changed $250,000 CRMLS
- 2017-09-26 Price Changed $298,500 CRMLS
- 2017-08-30 Listed $320,000 CRMLS
- 2010-08-31 Sold (MLS) $160,000 CRMLS
- 2010-07-15 Pending — CRMLS
- 2010-07-11 Price Changed $175,000 CRMLS
- 2010-06-28 Price Changed $180,000 CRMLS
- 2010-06-16 Price Changed $185,000 CRMLS
- 2010-06-06 Price Changed $189,000 CRMLS
- 2010-06-06 Price Changed $184,000 CRMLS
- 2010-05-19 Price Changed $189,000 CRMLS
- 2010-05-03 Listed $199,500 CRMLS
Cash-flow waterfall
monthlySold comps — $/sqft
last 12 mo · ≤1 miLoading sold comps…