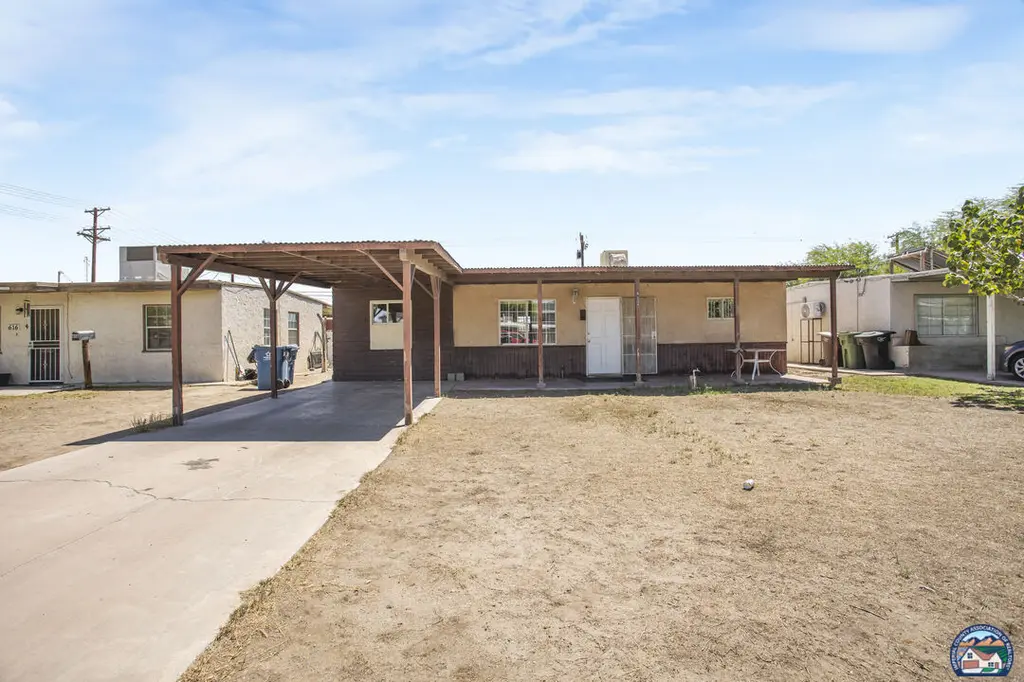
612 N C St
Imperial, CA 92251
$285,000C-
3 bd · 1.0 ba ·
960 sqft ·
Built 1954
· SingleFamily
· Active
· 10 DOM
Cashflow @ list (25.0% down · 7.5%)
Estimated rent
$2,374/mo
Mortgage (P&I)
−$1,495
Tax + insurance
−$234
HOA
−$0
Vac / Maint / Mgmt
−$499
Net cashflow
$147/mo
Annual
$1,762/yr
Cap rate
6.91%
Cash-on-cash
2.21%
DSCR
1.10
1% rule
0.83%
Cash to close
$79,800
Investor read
- This is a 3-bed/1.0-bath single-family listed at $285k.
- At list price, monthly cash flow is $147 ($2k/yr) — positive.
- The deal already cash-flows at list — no discount required.
- To meet the 1% rule (rent ≥ 1% of price), the offer needs to be $237k (16.7% below list).
- Only 10 days on market — expect competitive offers; lowballing is unlikely to land.
- Recommended offer: $237k (16.7% below list) — sets the bar for 1% rule.
- Local home prices are declining (-3.0%/yr); year-one equity from $2k of loan paydown is wiped out by about $9k of value loss. Plan a longer hold.
- Location reads 68/100 on livability (#286 in CA) — a middle-class / working-renter tenant base. Strengths: crime A+, housing A+, employment A-; Watch: amenities F, commute F, cost of living F.
- Imperial Unified (suburban): math 21% / reading 44% proficiency, ranked #281 of 517 in CA (top 54%) — families likely to look elsewhere, expect single-tenant / working-renter base with shorter leases.
- Zoned schools: Ben Hulse Elementary (math 25% / reading 43%, grade F, #755 of 1,571 statewide, top 49%, 794 students, 57% FRL); Frank M. Wright Middle (math 20% / reading 45%, grade F, #202 of 498 statewide, top 41%, 1,023 students, 61% FRL); Imperial High (math 17% / reading 60%, grade F, #567 of 1,170 statewide, top 49%, 1,362 students, 53% FRL) — zoned schools average 57% FRL vs 36% district-wide (21 pts higher); higher-poverty schools than district average — tighter screening recommended.
- Watch-outs: built in 1954 — expect roof / HVAC / electrical / plumbing capex.
- Market conditions: 120 active listings in the ZIP; solid renter incomes; 271 units permitted in Imperial County in 2024 (112 in 5+ unit buildings).
- Imperial County population projected at +7% by 2050 — modest demand growth; plan on rents tracking national, not racing it.
- Current owner paid $89k; list at $285k implies a 220% gain — meaningful room to come down on a strong offer.
- Climate carrying-cost: extreme-heat days projected 7→21/yr by 2055 (HVAC capex compounding) — expect insurance premiums to compound above CPI over the hold.
- Cap rate 6.9% vs local median 3.9% in Imperial — top-decile yield for the area; either an underpriced asset or a hidden risk that comps aren't pricing in. Stress-test before assuming the spread holds.
- This rent runs 31% of the median local income ($91k/yr) — at the standard rent-burdened threshold; future hikes will face affordability resistance.
Questions for listing agent
- Built in 1954 — when were the roof, HVAC, electrical panel, plumbing, and water heater last replaced?
- Is there a deadline driving the sale (1031 exchange, divorce, estate, relocation)? That informs how much negotiation room exists.
- What's the average days-on-market for RENTAL listings here right now (not sales)? A rising rental-DOM trend means longer vacancies and softer asking-rent achievability than the comps imply.
- What's the recent tenant-quality profile in this submarket — average credit score on applications, eviction rate, late-payment / NSF rate, and stable-employment percentage? A property-management company in the area should have these aggregated.
- How much new for-sale + rental construction is in the pipeline within 1–3 miles? Heavy new supply typically softens prices + rents 12–24 months out; constrained supply supports both.
CashFlowRE · CFR-XY68E259NHXG2K
· Data 21 h ago
cashflowre.app · 2026-05-29