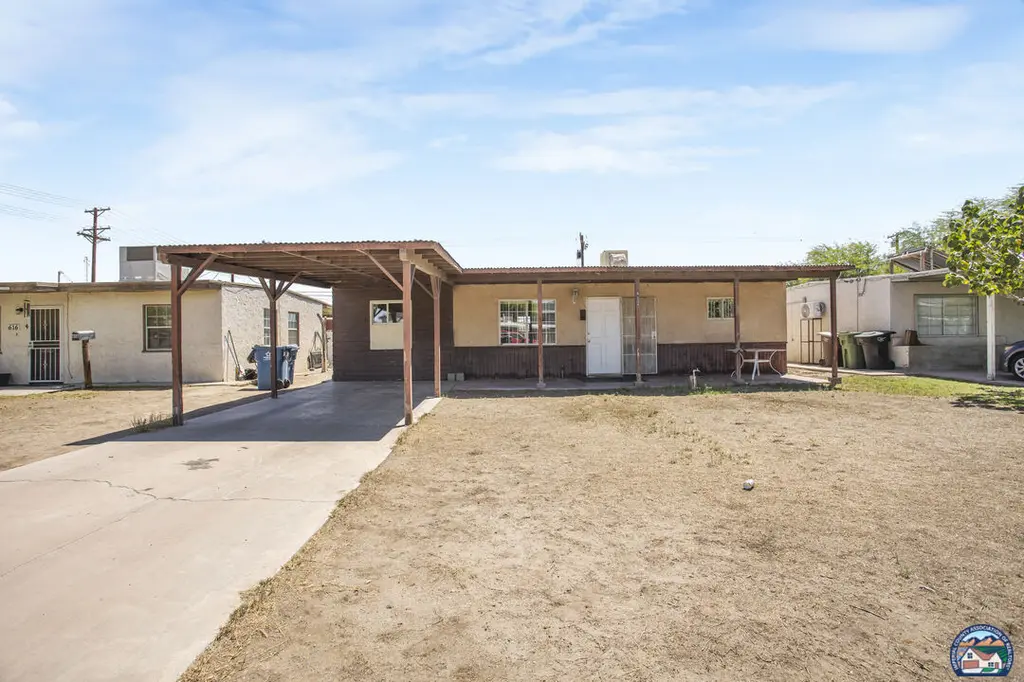
612 N C St · Imperial, CA
Flood risk 1/10 · Minimal
- FEMA flood zone
- X (unshaded)
- Chance of flooding over 30 yrs
- 0.0%
- Est. flood insurance / yr
- $507 – $1,088
Fire risk 3/10 · Minor
- Est. fire insurance / yr
- $659 – $1,223
Heat risk 10/10 · Severe
- Hot days now (above 114°F)
- 7 days/yr
- Hot days in 30 yrs
- 21 days/yr
Wind risk 1/10 · Minimal
- Chance of severe wind over 30 yrs
- —
Air-quality risk 3/10 · Minor
- Unhealthy air days now
- 2 days/yr
- Unhealthy air days in 30 yrs
- 3 days/yr
Risk factors via First Street. Map © Google.
Why this score? — see what drove the C- grade
The composite is a weighted blend of 9 inputs, each scored 0–100. Each bar is that input's sub-score; the figure is the points it added to the 100-point composite (weight × sub-score).
- Cash flow +16.1/30.0
- ARV discount +15.0/15.0
- DSCR +5.0/10.0
- Livability +3.4/5.0
- 1% rule +3.3/10.0
- Schools +3.0/10.0
- Rent growth +2.5/5.0
- Condition / age +2.5/5.0
- Appreciation +0.0/10.0
$285,000
🖨 Deal sheet (PDF) 📄 Offer letter ✓ Due diligence
Listing remarks
612 N C St Imperial CA is the perfect investment property. This property is situated in the ever-growing city of Imperial. The city of Imperial is the fastest growing city in Imperial Valley, new development and commercial buildings are bringing opportunities for investors. The 960 sqft home with 3 bedrooms and a bathroom sits on a massive 7,616 sqft lot. You can potentially add an ADU and bring additional rental income to your portfolio. On the other hand, you can also renovate this property and make it your forever home. Location is tranquil and the community is a center for scholars to grow their intellectual knowledge. Moving forward this is a property that can fit your vision.
Key facts
- Investment property
- Tranquil location
- 7,616 sq ft lot
Tags
Property features AI
Exterior
- Parking: 2 parking spaces total; 1-car carport
- Utilities: Public water; Public sewer; Natural gas available
- Home design: Single-family residence; Single story
- Construction: Stucco and wood siding exterior; Shingle roof; Slab foundation; Built on a 0.175-acre lot
- Exterior features: Covered patio/porch; Chain link fence
Interior
- Flooring: Carpet; Tile
- Bathrooms: 1 full bathroom
- Heating & cooling: Central heating; Central air conditioning
- Interior features: Gas water heater; Carpet and tile flooring
Neighborhood map
What this means for you Summary
Snapshot
- This is a 3-bed/1.0-bath single-family listed at $285k.
Deal economics
- At list price, monthly cash flow is $147 ($2k/yr) — positive.
- The deal already cash-flows at list — no discount required.
- To meet the 1% rule (rent ≥ 1% of price), the offer needs to be $237k (16.7% below list).
- Recommended offer: $237k (16.7% below list) — sets the bar for 1% rule.
- Cap rate 6.9% vs local median 3.9% in Imperial — top-decile yield for the area; either an underpriced asset or a hidden risk that comps aren't pricing in. Stress-test before assuming the spread holds.
Location & tenants
- Location reads 68/100 on livability (#286 in CA) — a middle-class / working-renter tenant base. Strengths: crime A+, housing A+, employment A-; Watch: amenities F, commute F, cost of living F.
- Imperial Unified (suburban): math 21% / reading 44% proficiency, ranked #281 of 517 in CA (top 54%) — families likely to look elsewhere, expect single-tenant / working-renter base with shorter leases.
- Zoned schools: Ben Hulse Elementary (math 25% / reading 43%, grade F, #755 of 1,571 statewide, top 49%, 794 students, 57% FRL); Frank M. Wright Middle (math 20% / reading 45%, grade F, #202 of 498 statewide, top 41%, 1,023 students, 61% FRL); Imperial High (math 17% / reading 60%, grade F, #567 of 1,170 statewide, top 49%, 1,362 students, 53% FRL) — zoned schools average 57% FRL vs 36% district-wide (21 pts higher); higher-poverty schools than district average — tighter screening recommended.
- Market conditions: 120 active listings in the ZIP; solid renter incomes; 271 units permitted in Imperial County in 2024 (112 in 5+ unit buildings).
- This rent runs 31% of the median local income ($91k/yr) — at the standard rent-burdened threshold; future hikes will face affordability resistance.
Forward outlook
- Local home prices are declining (-3.0%/yr); year-one equity from $2k of loan paydown is wiped out by about $9k of value loss. Plan a longer hold.
- Imperial County population projected at +7% by 2050 — modest demand growth; plan on rents tracking national, not racing it.
Negotiation context
- Only 10 days on market — expect competitive offers; lowballing is unlikely to land.
- Current owner paid $89k; list at $285k implies a 220% gain — meaningful room to come down on a strong offer.
Risks & watch-outs
- Watch-outs: built in 1954 — expect roof / HVAC / electrical / plumbing capex.
- Climate carrying-cost: extreme-heat days projected 7→21/yr by 2055 (HVAC capex compounding) — expect insurance premiums to compound above CPI over the hold.
Questions for the listing agent
- Built in 1954 — when were the roof, HVAC, electrical panel, plumbing, and water heater last replaced?
- Is there a deadline driving the sale (1031 exchange, divorce, estate, relocation)? That informs how much negotiation room exists.
- What's the average days-on-market for RENTAL listings here right now (not sales)? A rising rental-DOM trend means longer vacancies and softer asking-rent achievability than the comps imply.
- What's the recent tenant-quality profile in this submarket — average credit score on applications, eviction rate, late-payment / NSF rate, and stable-employment percentage? A property-management company in the area should have these aggregated.
- How much new for-sale + rental construction is in the pipeline within 1–3 miles? Heavy new supply typically softens prices + rents 12–24 months out; constrained supply supports both.
Investment metrics
- 1% rule
- 0.83% ✗
- Cap rate
- 6.91%
- Cash-on-cash
- 2.21%
- DSCR
- 1.10
- GRM
- 10.0
CMA / ARV
- ARV (on-the-fly)
- $357,120
- Comps found
- 2
Show comp detail 2 sales within ~0.75 mi
| Address | Dist | Beds/Ba | Sqft | Sold | Price | $/sf | Match |
|---|---|---|---|---|---|---|---|
| 618 N G St | 0.30mi | 2/1.0 (-1) | 960 (0%) | 16mo | $105,000 | $109 | 67 |
| 714 N F St | 0.23mi | 2/1.0 (-1) | 864 (-10%) | 10mo | $321,000 | $372 | 59 |
Match score weights: distance 35% · size 25% · config 20% · recency 20%. Top-matched comps best support the ARV.
Projected returns pro-forma
-3.0% appreciation · 3.0% rent growth · sell at horizon
- IRR
- -12.8%
- Equity multiple
- 0.54×
- Total profit
- $-36,945
- Equity at exit
- $42,494
- IRR
- -3.9%
- Equity multiple
- 0.74×
- Total profit
- $-20,587
- Equity at exit
- $24,642
Cash invested: $79,800 (down + closing). Projections, not guarantees.
Landlord ↔ Tenant lean methodology
- Overall (STATE)
- 18 Strongly Tenant-Friendly
- State California
- 18 Strongly Tenant-Friendly · D+13
- County
- — inherits STATE
- City
- — inherits STATE
ZIP-level market 92251
- Home prices YoY
- -9.8%
- Active inventory
- 120
- Price-to-rent
- 10.0×
Monthly cashflow live
- Estimated rent
- $2,374 medium interval (Pro) →
- Mortgage (P&I)
- −$1,495
- Tax from tax record
- −$115 /mo · $1,385/yr
- Insurance
- −$119
- HOA
- −$0
- Vacancy / Maint / Mgmt
- −$499
- Net cashflow
- $147
Break-even live
Sensitivity live
| Price | -10% $308 | -5% $227 | +0% $147 | +5% $66 | +10% $-15 |
|---|---|---|---|---|---|
| Rent | -10% $-41 | -5% $53 | +0% $147 | +5% $241 | +10% $334 |
| Rate | -1.0pp $290 | -0.5pp $219 | base $147 | +0.5pp $73 | +1.0pp $-2 |
UW: 25.0% down · 7.5% · 30yr · 1.5% tax · 5.0% vac · 8.0% maint · 8.0% mgmt
Financing live
Cash to close
- Down payment
- $71,250
- Closing costs
- $8,550
- Reserves months
- —
- Total cash needed
- —
Loan-product check · same deal, 3 products live
Conventional
25% down · 7.5% · 30yr
- Down + closing
- —
- Monthly P&I
- —
- Monthly cashflow
- —
- DSCR
- —
- Eligible?
- —
Personal DTI + credit; lowest rate.
DSCR
20% down · 8.5% · 30yr
- Down + closing
- —
- Monthly P&I
- —
- Monthly cashflow
- —
- DSCR
- —
- Eligible?
- —
No personal income docs; deal must DSCR.
Hard money
10% down · 12.0% · 12mo
- Down + closing
- —
- Monthly P&I
- —
- Monthly cashflow
- —
- DSCR
- —
- Eligible?
- —
Short-term bridge; refi at stabilization.
Listing history 9 events
-
2026-06-21days on market $285,000 Active 10 DOM
-
2026-06-19days on market $285,000 Active 8 DOM
-
2026-06-18days on market $285,000 Active 7 DOM
-
2026-06-17days on market $285,000 Active 6 DOM
-
2026-06-16days on market $285,000 Active 5 DOM
-
2026-06-15days on market $285,000 Active 4 DOM
-
2026-06-14days on market $285,000 Active 2 DOM
-
2026-06-13remarks 690-char remark
-
2026-06-13$285,000 Active 1 DOM
ⓘ Source: listings_history table (triggers on properties + properties_extension) + one-shot
backfill from property_details.listing_events for pre-trigger history.
Tax reassessment forecast CA · Resets to sale price
- Current annual tax
- $1,385 · $115/mo
- Projected year-2 tax
- $2,166 · $180/mo
- Expected delta
- +$781/yr (+$65/mo · 56.4%)
ⓘ Screening estimate from a state-policy table — verify with the county assessor before closing.
Climate risk First Street
- Flood 1/10 Low FEMA zone X (unshaded) · 0% chance over 30 yrs
- Wildfire 3/10 Moderate
- Heat 10/10 Extreme 7 d/yr ≥114°F today · 21 d/yr by 30 yrs out
- Wind 1/10 Low
- Air quality 3/10 Moderate 2 unhealthy d/yr today · 3 by 30 yrs out
Nearby sold comps map
Loading sold comps map…
Walkable amenities ~0.75 mi
Loading nearby amenities…
Taxation est. · year 1
- Rental income
- $28,489
- − Mortgage interest
- −$15,964
- − Property taxes
- −$1,385
- − Insurance
- −$1,425
- − Repairs & maintenance
- −$2,279
- − Management
- −$2,279
- − Depreciation
- −$8,291
- Taxable loss
- −$3,134
- Est. tax savings @ 24.0%
- +$752
- After-tax cash flow
- $2,514/yr
For passive investors: Depreciation is non-cash, so a rental often shows a tax loss while cash-flowing — sheltering income. Rental losses are passive: they offset passive income freely, and up to $25,000/yr can offset ordinary (W-2) income if you actively participate and your MAGI is under $100k (phasing out to $0 by $150k); unused losses carry forward. On sale, claimed depreciation is recaptured at up to 25%, and gains may owe capital-gains tax (a 1031 exchange can defer both). Figures are a year-1 estimate at your 24.0% rate — not tax advice; consult a CPA.
Schools (NCES district)
- District
- Imperial Unified
- NCES district ID
- 0618210
- Math proficiency
- 21% ▼ -21.00%
- Reading proficiency
- 44% ▼ -16.00%
- Median HH income
- $66,775
- Composite
- 29.79/100
- National rank
- #6424
- State rank
- #281 of 517 in CA
Livability — Imperial
- Score
- 68/100
- State rank
- #286
- US rank
- #9731
Category grades
Schools grade is shown separately in the Schools card above.
Census & demographics
- Census place
- Imperial, CA
- County
- Imperial County · 104,838 people
- City population
- 27,454
- Metro
- El Centro, CA
- Population (ZIP)
- 27,454
- Household income
- $90,709
- Rent vs Own
- Severe rent burden
- 410.0
Population outlook (Imperial County) Hauer SSP2
- Today (2025)
- 186,713 people
- By 2030
- 190,022 · +1.8%
- By 2040
- 195,993 · +5.0%
- By 2050
- 199,534 · +6.9%
- By 2075
- 216,878 · +16.2%
- By 2100
- 352,705 · +88.9%
Race, ethnicity, and origin ACS 2023
- Neighborhood character
- Predominantly Hispanic (83%)
- Race & ethnicity
- Hispanic / Latino 83% Two or more races 30% White 10% Asian 3% Black 3%
- Hispanic origin (detail)
- Mexican 80%
- Common ancestry
- Slovak 1%
- Foreign-born
- 24% · Canada, South Korea, Vietnam
- Languages at home
- 34% English-only · Spanish 63% Korean 1% Arabic 1%
Political lean MEDSL · Imperial
- 2024 margin
- Toss-up / Even · D 48.3% · R 49.1% · Other 2.6%
- 2008→2024 swing
- -27.0pp toward R · 2008: 26.2pp · 2024: -0.9pp
- All cycles
- 2024: R+0.9 2020: D+24.4 2016: D+41.1 2012: D+28.8 2008: D+26.2
Not yet ingested
- Civics
- —
Market trends
- HPI YoY
- ▼ -41.26%
- Current HPI
- 380.9947
- Rent YoY
- —
- Metro
- El Centro, CA
- State GDP YoY
- ▲ 3.21%
- F500 in state
- 116
Industry mix (Fortune 500 HQ in CA)
| Industry | F500 HQs | Revenue |
|---|---|---|
| Technology | 27 | $1,492B |
|
||
| Financial Services | 3 | $174B |
|
||
| Retail | 3 | $44B |
|
||
| Insurance | 3 | $26B |
|
||
| Media / Entertainment | 2 | $115B |
|
||
| Pharmaceuticals / Biotech | 2 | $62B |
|
||
Price history
+442.9% since first listed3 events — show timeline
- 2026-03-11 Listed $285,000 ICAOR
- 2001-11-30 Sold (Public Records) $89,000 Public Records
- 2001-09-12 Sold (Public Records) $52,500 Public Records
Property tax history
+4.7%/yrLatest (2025): $1,385 · +1.8% YoY. Source: county tax records.
Cash-flow waterfall
monthlySold comps — $/sqft
last 12 mo · ≤1 miLoading sold comps…